NQH2020 trade ideas

Trade Plan NQ Futures: week starting May 5th, 2024 Trade Plan NQ Futures: week starting May 5th, 2024
Based on the provided levels for the NQH2024 futures contract, here's a weekly trade plan focusing on trading from the pivot to the upside or downside targets:
Weekly Pivot: 17847 Current Price: 18000
Upside Targets:
First Target: 18090
Second Target: 18348
Third Target: 18605
Downside Targets:
First Target: 17731
Second Target: 17560
Third Target: 17378
Trade Plan:
Long Trades: Look for buying opportunities if the price remains above the weekly pivot (17847).
Entry: Consider entering long positions on pullbacks towards the pivot (17847) or if the price breaks above the current price (18000).
Targets: Target the upside levels of 18090, 18348, and potentially 18605.
Stop Loss: Place a stop loss below the pivot or below significant support levels identified during the week.
Short Trades: Consider shorting the market if the price breaks below the weekly pivot (18847) or the current price (18000).
Entry: Enter short positions on breakdowns below the pivot (17731) or the current price (18000).
Targets: Aim for downside targets of 17731, 17560, and potentially 17378.
Stop Loss: Place a stop loss above the pivot or above significant resistance levels identified during the week.
Risk Management:
Ensure proper risk management by sizing positions appropriately based on the distance to target and stop loss levels.
Consider using trailing stops to lock in profits as the price moves in your favor.
Monitor the market closely for any changes in price action or news events that could affect the trade.
Note: Always adapt your trading plan based on real-time market conditions and adjust your approach as necessary to manage risk effectively.

NQ in Daily FVG. Now We Wait On More Information#NQ weekly outlook 👀 5/5/24
(overall need more information to be confident in the direction)

NQ in Daily FVG. Now We Wait On More Information#NQ weekly outlook 👀 5/5/24
(overall need more information to be confident in the direction)

NQ1! SHORT FROM RESISTANCE
Hello,Friends!
NQ1! is trending down which is evident from the red colour of the previous weekly candle. However, the price has locally surged into the overbought territory. Which can be told from its proximity to the BB upper band. Which presents a great trend following opportunity for a short trade from the resistance line above towards the demand level of 17654.00.
✅LIKE AND COMMENT MY IDEAS✅

NQ PRICE PREDICTIONnot true unless it is false, price prediction is all bade on the change of character followed by liquidity sweeps and buy side orderblocks, main expectancy is to sweep previous highs. sell side order blocks reversing to buy side smc/ict mix

My personal analysis NQ for this upcoming week.NQ, along with other indices have been in a recent bullish run because of recent economic data and earning reports from the FOMC and the most impactful companies in the United States right now.
In the beginning of this past week, NQ has had a strong dump with price levels falling nearly 500 points (17900 to 17400) after a brief moment of consolidation. After further release of the interest rate decision, and a .1% increase in the unemployment rate, NQ exhibited a nice pump breaking through the previous high, justified by the many influential factors in the economy.
Now that in this upcoming week there isn't much major economic data to continue fueling the pump, I believe there will be another strong reversal after possible consolidation targeting levels around 17500, and I will be shorting soon after I see key levels broken.
I haven't looked into any anticipated earning reports that give more confirmation for either bias, but I will check those factors soon.
I am open to any critique in my analysis, any disagreements, and even confirmations. I am here to learn and grow along with everyone else.

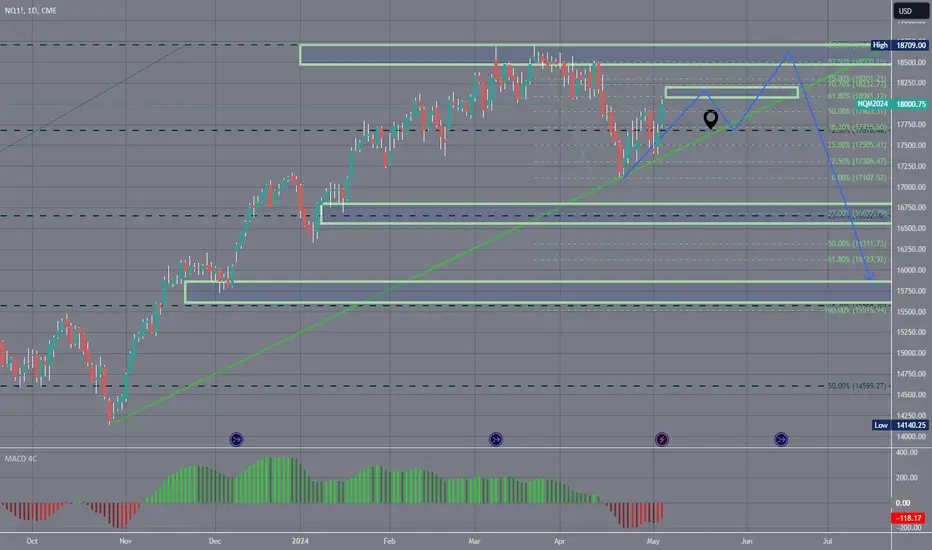
13 October 23 this move started at 10484.75 peaked 8 March 2413 October 2023 this move started at 10484.75 and peaked on 8 March 2024 at 18709.
The AI mania and perceived Fed 7/8 cuts took hold of the market. But even now that the potential for the 7/8 cuts have evaporated into maybe 0/2 the market continues to press higher. No meaningful correction has been seen, and after this week it's possible that we extend to the highs again before we see the possibility of a decent correction
waiting monday 04/05 for NASDAQ responseHello ! Here is my setup for the next week on Nasdaq. Main trend is very bullish, but as you can see, there is a bearish short trend. Also, this flag is a continuous trend pattern, that's mean I'm more waiting for a bearish move. So first signal we have is this RSI print, next signal for enter in a short is a rejection of the price on this level (2 TP). If he break this line by the top, I have 2 options, if I see a long setup then I will go for it, but if the market don't show volatility I'm going to be disciplined and do nothing.

Nasdaq 100 Peak 2024 ?Will the 2021 peak happen again ?
consolidation occurs like in 2021, will history repeat itself?

Forecast bullish for MNQ on week #18I think MNQ will have a retracement at the beginning of the week to the zone I marked up between monday and tuesday and after that it could be mainly bullish for the rest of the week until hits the upper zone around 18100


NQ1!The NASDAQ 100 index is currently indicating a sell zone with its value at 17988.00 Traders may consider taking profit at various levels, such as 17,872.42, 17,700.00, and 17,601.18, as these points represent potential profit-taking opportunities. Additionally, it's prudent to set a stop loss at 18,861.78 to mitigate potential losses in case the market moves against the position. Monitoring these levels and adhering to a well-defined trading plan can help traders navigate the market with confidence and discipline.

NQ W/D Analysiswatching the willingness for NQ to break April 19 low.
Note weekly FVG SIBI (right). Simultaneously, note 1D BA FVG SIBI (left).
Break below April 19 validated shorts
On standby. Just day trades , which i don't post here.

NQ Outlook 4/28Bearish on NQ. PDAs as identified. Trying not to spend too much time predicting the narrative at the beginning of the week, however price is likely to interact with these zones.

NQM2024(NASDAQ100)I think price take the Buyside Liquidity and going to Daily FVG.. then going to Sellside liquidity equal Lows.

NQ sellMonthly, Weekly, Daily Breaker Overlap with fvg.
hopefully ENTRY COMES AT 10-11 OR 2-4 FOR TE UNICORN MODEL.

NQ Power Range Report with FIB Ext - 5/3/2024 SessionCME_MINI:NQM2024
- PR High: 17808.00
- PR Low: 17722.00
- NZ Spread: 192.50
Key economic calendar events (loaded Friday)
08:30 | Average Hourly Earnings
- Nonfarm Payrolls
Unemployment Rate
- 09:45 | S&P Global Services PMI
10:00 | ISM Non-Manufacturing PMI
- ISM Non-Manufacturing Prices
AMP margins increase for expected vol spike
- Pushed value back into week highs
- Quick supply response above prev 2 session highs
- Ranging around prev session high
Evening Stats (As of 1:45 AM)
- Weekend Gap: +0.16 (filled)
- Gap 5/2 +0.07% (filled)
- Gap 10/30 +0.47% (open < 14272)
- Session Open ATR: 309.57
- Volume: 27K
- Open Int: 236K
- Trend Grade: Bull
- From BA ATH: -5.0% (Rounded)
Key Levels (Rounded - Think of these as ranges)
- Long: 18675
- Mid: 18106
- Short: 16963
Keep in mind this is not speculation or a prediction. Only a report of the Power Range with Fib extensions for target hunting. Do your DD! You determine your risk tolerance. You are fully capable of making your own decisions.
BA: Back Adjusted
BuZ/BeZ: Bull Zone / Bear Zone
NZ: Neutral Zone

Longing NAS100, Buying (MNQ1!)Narrative: Price is currently in an uptrend,
price seems to have taken out sell side liquidity
(EL). After price takes out sell side liquidity(SSL) price
retraces and takes out internal liquidity & is now
expanding to the upside to take out buy side liquidity.

NASDAQ long and hit this level before the week endsNasdaq longs will play and hit this level by the end of the week at most

ES:NQ, ICT reversal under lows, includes text boxes on thoughtsHeres my long for ES, using both NQ and ES charts, switching between timeframes, and I have written down text for explaination on what I see.


