Supply Zones With Orderflow on BOOKMAPsunday supply levels are being charted as i use bookmap to show what analysis can be portrayed along with upside levels and levels where u can possibly see a short side drop/ Scalp.
NQZ2023 trade ideas

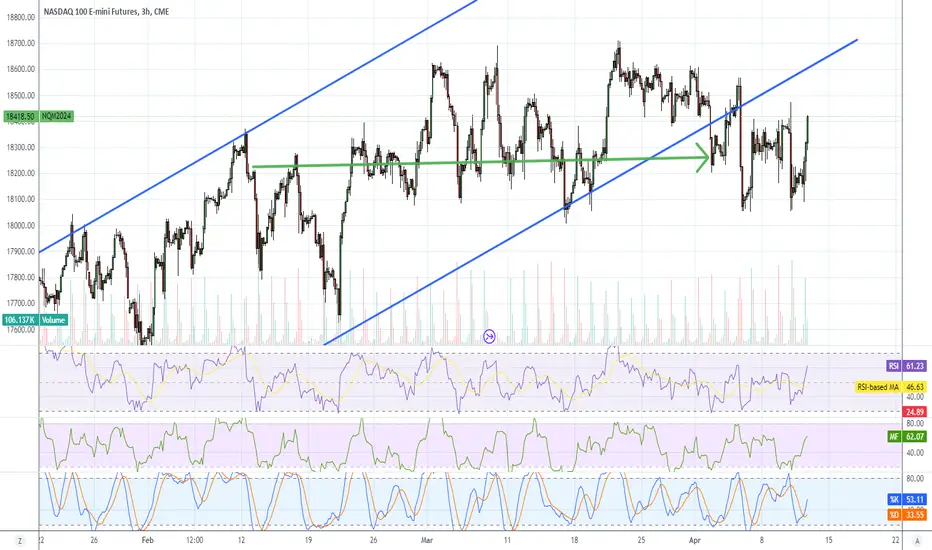
Weekly Plan NQ Futures 4/14/2024Weekly plan: NQH2024
SEED_ALEXDRAYM_SHORTINTEREST2:NQ FUTURES 4/07/2024
18406 >> 18566 >>> 18718
Weekly pivot: 18284, Now 18172, Weekly Open TBD
18063 >> 17934>>> 17734
-------------------------------------------------
Based on the provided levels for the NQH2024 futures contract, here's a weekly trade plan focusing on trading from the pivot to the upside or downside targets:
Weekly Pivot: 18284
Current Price: 18172
Upside Targets:
First Target: 18406
Second Target: 18566
Third Target: 18718
Downside Targets:
First Target: 18063
Second Target: 17934
Third Target: 17734
Trade Plan:
Long Trades: Look for buying opportunities if the price remains above the weekly pivot (18284).
Entry: Consider entering long positions on pullbacks towards the pivot (18284) or if the price breaks above the current price (18172).
Targets: Target the upside levels of 18406, 18566, and potentially 18718.
Stop Loss: Place a stop loss below the pivot or below significant support levels identified during the week.
Short Trades: Consider shorting the market if the price breaks below the weekly pivot (18284) or the current price (18172).
Entry: Enter short positions on breakdowns below the pivot (18284) or the current price (18172).
Targets: Aim for downside targets of 18063, 17934, and potentially 17734.
Stop Loss: Place a stop loss above the pivot or above significant resistance levels identified during the week.
Risk Management:
Ensure proper risk management by sizing positions appropriately based on the distance to target and stop loss levels.
Consider using trailing stops to lock in profits as the price moves in your favor.
Monitor the market closely for any changes in price action or news events that could affect the trade.
Note: Always adapt your trading plan based on real-time market conditions and adjust your approach as necessary to manage risk effectively.

Nasdaq Analysis: Assessing Risks and RewardsThe Nasdaq currently exhibits a compelling trajectory within a well-defined pitchfork channel. While this pattern presents enticing opportunities, it is essential to approach investments with caution due to the associated risks.
Investors should be aware that the current juncture is particularly precarious, as any correction towards the pitchfork's last support level could result in losses of up to 23% . Despite the potential for attractive rewards (18%), my investment strategy suggests that the risk-to-reward ratio may not be favorable at this point.
For those considering short-term trading, Nasdaq does offer opportunities. However, it is crucial to bear in mind the inherent risk associated with this market. Nasdaq's dynamics are influenced by a multitude of algorithms, adding an extra layer of complexity to the trading environment.
My investment method :
I am not interested in investing in the indicator at theses prices. Congratulations for thoses who bought at 10k-11k.

NQ plan of the week.This is just the way that i see price action for this week.
Price is looking for IRL at the moment.
This can be found inside the unicorn model on the HTF.
This will complete the MMSM.
After taking IRL, price will seek for ERL.
Starting with a SMT on ES beginning of the week. (making the low of the week)
Just to start a MMBM.
Target of the MMBM is the old highs of the model before.
PLAN THE TRADE , TRADE THE PLAN.
GC.

botThe trading strategy using Fibonacci levels 68 and 50 depends on using these levels as support and resistance levels. Here are the steps:
1. **Determining the trend:** Determine the general direction of the market (bullish or bearish).
2. **Entry into the market:**
- Look for opportunities to enter the market when the price approaches the 68 or 50 Fibonacci level.
- You may want to wait for additional confirmations such as the formation of a candle pattern or the price breaking the Fibonacci level by a certain percentage.
3. **Place stop loss:**
- Place the stop loss close to the level at which you entered the trade.
- The breakout of level 68 or 50 can be used as an indicator of trend change and as an indicator to place a stop loss.
4. **Determining the target point:**
- Set the target point at the desired profit level, in this case it is 30%.
- The reward/risk ratio can be used to determine the target point and stop loss more accurately.
5. **Risk management:**
- Use a risk ratio of 5% of capital in each trade.
- Do not exceed this percentage, whatever the circumstances.
6. **Deal follow-up:**
- Follow up the deal regularly to ensure it is progressing as required.
- You may need to adjust your stop loss or target point if market conditions change.
Please note that you should always analyze the market carefully and use other technical indicators such as the Relative Strength Index (RSI) or moving averages to enhance trading decisions.

NQ Paper Trade Let see if my prediction is correct!Basing my technical analysis to see if my paper trade will be correct! Price Target of 18449.50 is an area it retested on the daily time frame. Also taking a long position due to price sitting at support level. Price has also retest my trendline to tell me of bullish movement! So hopefully We can get our TP hit!

ICT's NQ Market Maker ModelThe market maker model is great for predicting continuation in a directional change in trend. Key to Identifying the MMM is to watch for a major high to be taken then a long period of flat price action (continuation). The sell leg should an match the order blocks on the buy side. Target is the retracement of the buyside leg.

NQ! Paper Trade! 15min Entry, 1hr to close! Short Position I hit my weekly goal early this week! So decided to paper trade today to show you guys you have to have really good technical analysis to win your trades! I recommend if you’re not trading You have to chart and analyze so you have good chances to win your trades! So now let’s break down this trade that I took on my paper trade account I took the trade at the 15 minute chart and waited for Price action to retest my trendline. Then I jumped to the 1 hour chart to draw a green circle where price will hit at the 1 hour chart To look for order block where price will reach! With great success I was able to close the trade and make a profit of $6241!


NQ: 4/08/24 - 4/12/24- Bearish, expecting a run through prev. week low after buyside liquidity purge.
- SMT at new internal range highs will confirm the idea
Goal is 6R on the week.
The calendar is dead until CPI Wednesday. It's best to wait until then before going risk on.

NQ Power Range Report with FIB Ext - 4/12/2024 SessionCME_MINI:NQM2024
- PR High: 18501.75
- PR Low: 18477.00
- NZ Spread: 55.25
No significant calendar events
Value back inside of range above 18400
- Prev session closed as engulfing bar
- Weekly high lift following widest session range of the week
- Holding value near prev session close, below the high
Evening Stats (As of 1:05 AM)
- Weekend Gap: +0.27% (filled)
- Gap 10/30 +0.47% (open < 14272)
- Session Open ATR: 260.80
- Volume: 16K
- Open Int: 261K
- Trend Grade: Bull
- From BA ATH: -1.0% (Rounded)
Key Levels (Rounded - Think of these as ranges)
- Long: 18675
- Mid: 18106
- Short: 16963
Keep in mind this is not speculation or a prediction. Only a report of the Power Range with Fib extensions for target hunting. Do your DD! You determine your risk tolerance. You are fully capable of making your own decisions.
BA: Back Adjusted
BuZ/BeZ: Bull Zone / Bear Zone
NZ: Neutral Zone


NQ Hourly MegaphoneBullish consolidation on hourly timeframe, may coincide with data releases for breakout/breakdown

Back Into Near-Term ResistanceThe key daily support zone in NQ held again this morning and now price trades back into this week's resistance at 18400... Great action today - Patient now!

Growing Divergences in Small vs Large CapsWhat do the labor market and the stock market have in common? They are both showing a huge divergence between the fortune’s big companies and smaller companies.
From 2009 to 2021, the large caps in the S&P 500 and the small caps in the Russell 2000 moved more-or-less in lock step. Since the end of 2021, however, investors in the S&P 500 have earned a 9% return. Meanwhile, investors in the Russell 2000 small caps are down nearly 20% from the index’s peak.
U.S. Labor Market Survey Data
We are seeing a similar divergence in U.S. labor market data as well with a huge gap developing between two different surveys conducted by the Bureau of Labor Statistics. The establishment survey, which is a survey mainly of big businesses, shows over half a million jobs were created over the course of December and January. By contrast, the household survey – which polls 60,000 American families each month and does a better job of capturing job creation among small and mid-sized firms – shows 1.2 million jobs have been lost in December and January, and nearly 700,000 people have left the labor force altogether.
The Impact of Interest Rates
Why would small businesses suffer while large companies prosper? One reason might be interest rates. Many large companies have significant cash reserves which are now earning 5% returns as a result of Fed rate hikes. Also, many large companies financed themselves by issuing bonds when yields were low during the pandemic. By contrast, many smaller businesses do not have large piles of cash earning interest in T-Bills. They typically borrow from banks and suffer the effects of higher rates more quickly than their larger counterparts.
The good news for small firms is that if and when the Fed begins to cut rates, their stocks might outperform the big guys in the S&P.
If you have futures in your trading portfolio, you can check out on CME Group data plans available that suit your trading needs www.tradingview.com
By Erik Norland, Executive Director and Senior Economist, CME Group
*CME Group futures are not suitable for all investors and involve the risk of loss. Copyright © 2023 CME Group Inc.
**All examples in this report are hypothetical interpretations of situations and are used for explanation purposes only. The views in this report reflect solely those of the author and not necessarily those of CME Group or its affiliated institutions. This report and the information herein should not be considered investment advice or the results of actual market experience.

NQ Power Range Report with FIB Ext - 4/11/2024 SessionCME_MINI:NQM2024
- PR High: 18190.75
- PR Low: 18160.00
- NZ Spread: 68.75
Key economic calendar events
08:30 | Initial Jobless Claims
- PPI
13:00 | 30-Year Bond Auction
Another margin increase from AMP for expected vol spike
- Potential daily inside print
- Holding near prev session close
- >100 points from prev session low
Evening Stats (As of 12:05 AM)
- Weekend Gap: +0.27% (filled)
- Gap 10/30 +0.47% (open < 14272)
- Session Open ATR: 252.47
- Volume: 22K
- Open Int: 256K
- Trend Grade: Bull
- From BA ATH: -2.7% (Rounded)
Key Levels (Rounded - Think of these as ranges)
- Long: 18675
- Mid: 18106
- Short: 16963
Keep in mind this is not speculation or a prediction. Only a report of the Power Range with Fib extensions for target hunting. Do your DD! You determine your risk tolerance. You are fully capable of making your own decisions.
BA: Back Adjusted
BuZ/BeZ: Bull Zone / Bear Zone
NZ: Neutral Zone


ICT quarters theoryAfter large displacement like news events . Anticipate retracement based on bias.
Bearish trend - look for retracement into lower 25% range then displacement lower.
bullish - look for retracement into upper 75% of range , then displacement higher.

NQM2024(Nasdaq)The price can go up to the 50% area of its falling log by taking the Sellside Liquidity equal Lows H4

NQ Power Range Report with FIB Ext - 4/10/2024 SessionCME_MINI:NQM2024
- PR High: 18384.25
- PR Low: 18370.75
- NZ Spread: 30.0
Key economic calendar events
08:30 | CPI (3x)
10:30 | Crude Oil Inventories
13:00 | 10-Year Note Auction
14:00 | FOMC Meeting Minutes
AMP margin increase for expected vol spike
Evening Stats (As of 12:05 AM)
- Weekend Gap: +0.27% (filled)
- Gap 10/30 +0.47% (open < 14272)
- Session Open ATR: 238.30
- Volume: 11K
- Open Int: 259K
- Trend Grade: Bull
- From BA ATH: -1.6% (Rounded)
Key Levels (Rounded - Think of these as ranges)
- Long: 18675
- Mid: 18106
- Short: 16963
Keep in mind this is not speculation or a prediction. Only a report of the Power Range with Fib extensions for target hunting. Do your DD! You determine your risk tolerance. You are fully capable of making your own decisions.
BA: Back Adjusted
BuZ/BeZ: Bull Zone / Bear Zone
NZ: Neutral Zone

DEMO: ict run on stops, market structure shift, fvg entryDEMO: ict run on stops, market structure shift, fvg entry

Helping you map out your gameplanE-mini S&P (June) / E-mini NQ (June)
S&P, yesterday’s close: Settled at 5253.25, up 0.25
NQ, yesterday’s close: Settled at 18,295.00, down 5.75
E-mini S&P and E-mini NQ futures were little changed to start the week as traders and investors await tomorrow’s CPI slate. Given last Thursday's fallout and Friday's stronger-than-expected headline job creation, one could perceive the consolidation as healthy. While there was some construction within the Treasury complex yesterday, we must also keep a close eye on rates as we move through the data-heavy middle of the week.
Price action in E-mini S&P futures held an early low yesterday after the opening bell, creating first key support at 5245.25-5246.50, while E-mini NQ futures have a similar mark with major three-star support at 18,228-18,249. The bears must test and violate these levels in order to potentially break the consolidation ahead of CPI. To the upside, a move out above second key resistance aligning with Friday’s high at 5268.75-5272.50 in the E-mini S&P and 18,406-18,446 in the E-mini NQ could begin to spark a pre-CPI melt, back into the thick of the damage, where indices began rolling over Thursday.
Bias: Neutral
Resistance: 5264.25*, 5268.75-5272.50**, 5279.25-5282**, 5295.25-5300.75***, 5207-5208.50***
Pivot: 5252.50-5253.25
Support: 5245.25-5246.50**, 5231.25-5237***, 5224.50**, 5212.75-5215.50**, 5203.75-5206.75***, 5191.50-5196.75***, 5163.75**, 5145-5147.25***, 5123.75-5124.25***, 5112.25***
Micro Bitcoin (April)
Yesterday’s close: Settled at 72,110, up 4,355
Bias: Neutral/Bullish
Resistance: 72,110-72,530**, 73,410-73,600***, 74,800-75,300***, 80,503***, 82,110***
Pivot: 71,800
Support: 69,610-69,900**, 68,650-68,900**, 67,755***, 66,330-66,500***, 64,715-65,260***, 62,955-63,435**, 60,830-61,680***
NQ (June)
Resistance: 18,370-18,376**, 18,406-18,446**, 18,475-18,498**, 18,568-18,607***, 18,691-18,709***
Pivot: 18,300-18,310
Support: 18,228-18,249***, 18,173-18,191**, 18,102*** 18,051-18,070***, 18,006-18,029***, 17,767-17,881****
CME Real-time Market Data help identify trading set-ups and express my market views. If you have futures in your trading portfolio, you can check out on CME Group data plans available that suit your trading needs www.tradingview.com
*Trade ideas cited above are for illustration only, as an integral part of a case study to demonstrate the fundamental concepts in risk management under the market scenarios being discussed. They shall not be construed as investment recommendations or advice. Nor are they used to promote any specific products, or services.
Futures trading involves substantial risk of loss and may not be suitable for all investors. Trading advice is based on information taken from trade and statistical services and other sources Blue Line Futures, LLC believes are reliable. We do not guarantee that such information is accurate or complete and it should not be relied upon as such. Trading advice reflects our good faith judgment at a specific time and is subject to change without notice. There is no guarantee that the advice we give will result in profitable trades. All trading decisions will be made by the account holder. Past performance is not necessarily indicative of future results.
