First correction then rise!This chart has been created for education & entertainment and this is not a trading advice
COSUSDT trade ideas

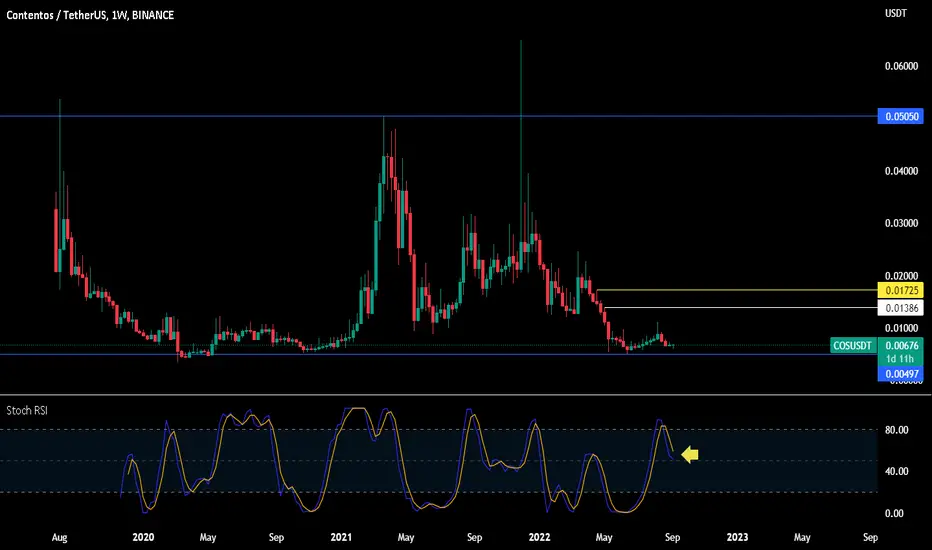
COSUSDT#COSUSDT
MACD is showing bullish RSI is neutral EMAs showing a bullish move Accumulation distribution is bullish Fib retracement is showing bullish Parabolic SAR is neutral ZELMA is showing uptrend-move Awesome oscillator is showing bullish
in daily chart time-frame we have falling wedge pattern as you can see at the chart and
we have powerful support zone that's give us a signals for long move i expect there will be a correction move

COSUSDT#COSUSDT
in daily chart time-frame we have falling wedge pattern as you can see at the chart and
we have powerful support zone that's give us a signals for long move i expect there will be a correction move MACD is showing bullish RSI is neutral EMAs showing a bullish move Accumulation distribution is bullish Fib retracement is showing bullish Parabolic SAR is neutral ZELMA is showing uptrend-move Awesome oscillator is showing bullish

COSUSDT | BREAKOUTCOSUSDT has been in downtrend and recently broken above the falling resistance.
The price is currently trading above the resistance.
The bulls are in control.
Manage your trades accordingly.

$cos - updatehopped of this 3 times which has cost me 11% approx to chase different shitcoins
happy i did
now back in this bubba before it blows
both weekly and daily stoch's about to cross
been consolidating under the 200 or resistance for since May
giving it 2 more days otherwise will forget it existed :)
wee bit of volume burst and we commence fomo

$COSthought i'd post the usd pair
its at HTF range low and unless delisted will pump ,since Binance are investors in so recon its not going anywhere
stoch turning up from the mid range usually leads to an explosive move up
got 2 minor levels to take out before we go insane
risk / reward is too tempting to ignore along with gut feeling saying fomo soon ( once we close above 200 on the daily btc pair)
wondering where to put my sell order , 120 sats is decent but may pop to 170
COS/USDT re-buy zoneHey traders!
Let's start the day with COS coin. We see the COS approaching interesting zone of $0.0068 zone which is major resistance for this coin. Breaking this zone would mean instant breakout but pressure from bears can stop that breakout. So we have 2 scenarios and all we can do now is wait and see what will happen))
If you like ideas provided by our team you can show us your support by liking and commenting.
Yours Sincerely,
Swallow Team 🔱
Disclamer:
We are not financial advisors. The content that we share on this website are for educational purposes and are our own personal opinions.

COS/USDT good time to buy!Hey traders!
Let's talk about COS coin. As we can see it was in great triangle formation from where it had a major breakout and had 38%. At the moment the price is sitting above $0.0082 zone which is one great confirmation that from now that zone has turned from Resistance to Support. As always green zone is our target zone and red zone is for buy zones))
If you like ideas provided by our team you can show us your support by liking and commenting.
Yours Sincerely,
Swallow Team 🔱
Disclamer:
We are not financial advisors. The content that we share on this website are for educational purposes and are our own personal opinions.

COS/USDTHuge Cup & Handle on the daily on the Monthly and Weekly chart.
A doji candle presented for the month of November which shows that december is a solid green month for COS
I will be taking profits at the first TP2 at around 0.06 because im quite positive that we will break the neckline of 0.04


COS inside weekly triangle#COS/USDT
$COS is inside a weekly triangle, and price struggle to break out from upper line.
🐮 breaking out from descending resistance can head up price to resistance zone around $0.04 (more than 130%).

COSUSDT (COS) Midhigher tf Range Updated till 21-3-22COSUSDT (CONTENTOS) mid-higher timeframe range. the chart is not as clean as others. this alt been brutally used by P and D groups, as we can see the wicks. and of course the insane pump and dump from December 03 2021 is very good indicator about how risky is this alt is. there were intraday setups and swing setups. the swing setups looks more reasonable here. The risk and reward on swing setups here is high if a trader can utilize the zones properly.

SAK Assets DAY 2The project is a Reverse Engineering of the indicators that most of ETF systems use, including the world's largest investment fund "BlackRock" which controls 8 Trillions dollars.
What if you can make 10% of your capital every day ?
👉 After 90 days/operations the 1000 dollars can reach 4,8 Million dollars :)


COSUsdti think this is good for save but better reaseasrch and not use more money on this all say on this market better save more money on top 10 coins
on this coin need take risk so better for good profit use low money for not lose more on this unstable market
GL
EntryPoint(use 3 point for entry this area is good for entrypoint better u set any think better btc more fal can use bottomer or toper GL)
EntryPoint:
0.01814
0.01660
0.01590
Supports:
0.01431
0.01288
0.01107
0.00913
Resistance:
001979
Targets:
0.02282
0.02631
0.03222
0.04171
For mid time and HODL:
0.05791
0.06873
0.08792
GL

COS can make a rebound with 40% to 100%as we see, correction is almost done
the rebound can make a huge pump to $0.03 or retest $0.044 again
stop-loss
below the uptrend around 0.0213
or the under previous Support at 0.02048
Good Luck :)

COS - Entry and exitContentos is really a brilliant project. You can learn more about their technology here (www.contentos.io)
Buy on retest of this macro line. Has been pushing the price up for many weeks. In fact, last 8 weeks we almost visit the line every time. When and if bull cycle recovers aim to take profits at 1.618 and 2.618 region.

COS boom?Risk warning, disclaimer: the above is a personal market judgment based on published information and historical chart data on Tradingview, all analysis is only subjective. Hope investors consider, I am not responsible for your investment decision. Thank you.
Good luck.


COS reach profit target after 8 daysRisk warning, disclaimer: the above is a personal market judgment based on published information and historical chart data on Tradingview, all analysis is only subjective. Hope investors consider, I am not responsible for your investment decision. Thank you.
Good luck
