COTIUSDT IDEAFalling wadge up side breakout is already done in 1D time frame
Expecting massive bullish wave moving as expected running in 50% profit so fa
COTIUSDT.P trade ideas

COTI ANALYSIS (1D)We are inside a large diametric, where the E wave itself is a twisted diametric. We are now in wave f of E. We expect the fluctuations plotted on the image from COTI
For risk management, please don't forget stop loss and capital management
Comment if you have any questions
Thank You

COTIUSDT IDEAHello Trading view Family / Fellow Traders.
I hope you have used and benifited from the previous analysis .
In today trading session we are monitoring COTIUSDT for a buying opportunity...
COTIUSDT UPDATE
Coti has breaked the main Falling Wedge in 1D timeframe .
Expecting Massive Bullish Wave📈
Here it has Maximum chance we can see gain up to 55% in next few days.

finally coti breaking out seems like coti has already bottomed out and finally looks juicy for midterm
breaking falling wedge in 3 days timeframe expecting successful breakout incase of successful breakout expecting solid recovery towards 0.20$ in midterm
keep eyes on that and keep risk under control

COTI COIN - BULL RUNThe Crypto Bull run is now going to begin, and as per technical analysis, the COTI COIN will become a rocket soon.
There are some target on cards that will hit soon.
Buy Call: $0.0509
Target 1: $0.0648
Target 2: $0.08199
Stop Loss: $ 0.03914


COTI/USDT Break Key Level, Bullish Momentum or false breakout? 💎 COTI has certainly piqued our interest. Having broken through a formidable resistance zone, COTI showcases potential bullish momentum, especially after spending 52 days in a sideways pattern within that range.
💎 Currently, COTI is in a retesting phase post its breakout from the strong resistance. A bounce in this region would pave the way for a continued upward trajectory.
💎 However, should COTI fail to maintain its position and close below the resistance zone, it might indicate a false breakout. In such a scenario, COTI could descend towards the nearby demand at $0.0415.
💎 A bounce at this point might lead to an upward retest of the resistance due to the false breakout, only to potentially decline again towards the demand at $0.039 or even approach the robust support zone.

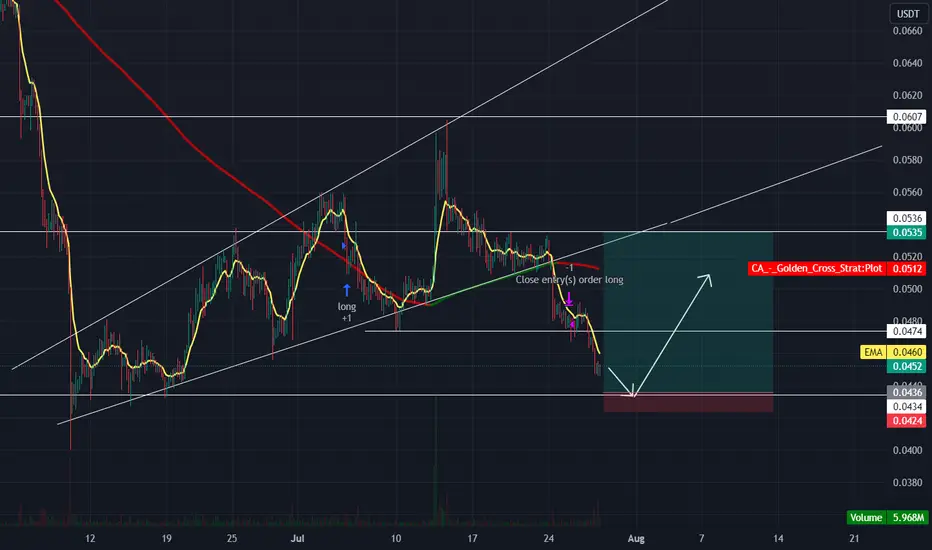
COTIUSDT 4HCOTIUSDT 4H Waiting for price to close above trendline channel before long Entry a retest will make a lot of sense

COTI / COTIUSDTGOOD LUCK>>>
• Warning •
Any deal I share does not mean that I am forcing you to enter into it, you enter in with your full risk, because I'll not gain any profits with you in the end.
The risk management of the position must comply with the stop loss.
(I am not sharing financial or investment advice, you should do your own research for your money.)

COTIUSDT - BULLISHCOTI is giving breakout,it will pump very hard,so keep an eye on this.
also buy in spot for short term like .

End of cicle COTICoti end of cicle, 1.618 fix extension, ABC complete.
Weekly bearish breaker to test around 0.31usd long term.
NFA


COTI ANALYSIS (1D)Hi, dear traders. how are you ? For a long time, the COTI symbol has been falling with an almost steep slope, and it has become difficult for some traders to predict its direction.
In this analysis, I have tried to predict the future path of COTI as much as possible with a quiet chart.
By checking the chart and wave counter, I realized that we are in a diamond diametric correction pattern.
On the chart, where it says "Start of correction" is the point where our diametric diamond started.
Looking at the branches, it looks like we are now in wave E of this diametric.
By hitting the green area, we expect the E wave of this diametric to end and we enter the rising F wave of this diametric.
Here is the path I envision for COTI on the current data, on the daily time frame.
For risk management, please don't forget stop loss and capital management
Comment if you have any questions
Thank You

COTI Coin is considered a security by the SECRecently, the U.S. Securities and Exchange Commission (SEC) classified COTI (COTI Coin) as a security. This means that COTI, the native cryptocurrency of the COTI network, is now subject to securities regulations and requirements imposed by the SEC.
The decision to categorize COTI as a security by the SEC signifies that it is considered an investment contract, representing ownership or participation in the COTI project or platform. Consequently, COTI will need to comply with applicable securities laws, which may include registration, reporting, and other regulatory obligations.
This classification by the SEC highlights the increasing attention and oversight of cryptocurrencies, particularly those that possess features resembling traditional securities. Companies and individuals involved in the cryptocurrency industry must remain informed about regulatory developments and ensure compliance with relevant laws to operate within the bounds of the law.
My price target for COTI is the next strong support, $0.038.
Looking forward to read your opinion about it!

COTI formed bullish Shark for the next pumpHi dear friends, hope you are well and welcome to another new trade setup of COTI coin with US Dollar pair.
Our last successful trade of COTI was the below one, which was almost 60% pump:
Now on a 4-hr time frame, COTI has formed a bullish Shark for the next bullish reversal.
Note: Above idea is for educational purpose only. It is advised to diversify and strictly follow the stop loss, and don't get stuck with trade.

COTI Possible Playout Chart The price movement of COTI is predicted to experience a decline due to the update on treasuries by the COTI network, which will be implemented on August 1, 2023. The discontinuation of the staking multiplier feature is causing holders to sell their assets. Currently, COTI is potentially going to experience a decrease to $0.04 in the next 1-2 weeks, with an estimated percentage decrease of -12%. Therefore, it is advisable to wait and see for now. #DYOR (Do Your Own Research).

COTIusdtCOTI has broken out above the trendline and is bouncing in OB three times, indicating that it is respecting buyers from the area. This presents a second entry opportunity for potential gains. Best of luck! :P

COTI (Y23.P2.E1). Macro goldern fib. levelsHi Traders,
On this chart, it seems that we have the fib extension of 1.618 further down and we have the fib macro level of 0.618 on the weekly here if we include the wicks.
For now, I think the pattern also suggests both levels are relevant.
Averaging in here based on the weekly chart makes sense.
Regards,
S.SAri
another fib perspective

Exaggerated Bearish Divergence for COTI @ 15mins time frameExaggerated Bearish Divergence can be formed when there is Double top on Price and when Relative Strength Index(RSI) is making Lower Highs and forming a Descending Triangle Pattern. Took position on 0.04827, and put a stop loss slightly above 50ma.

COTIas we can see coti had taken bearish move but as per technical wait until it comes to the support then we can take a long, wait till it comes to the support.
COTIUSDTCOTIUSDT is in bullish trend there is no reversal sign here which means trend is going to continue.
We take trade at CMP. then our TP,s will hit soon.l

#COTI LONGlong coti as it is following the paattern and moving in range from last 3 weeks we can expect a good move from here add coti in the cart and wait.

#COTI long#COTI open a long position it will going to follow the pattern, hoping for a good move of around 10%.cheers follow for more.
