INDIA COVID Wave incoming Update IVNext wave for India appears to be projected about 8 August 2022.
It is already on the rise...
CONFIRMED_IN trade ideas

INDIA COVID Wave incoming Update IIIA week later from the last update, we see a massive spike in the COVID cases.
First, as expected since Oct 20, at the turn of the year, the next wave is set upon India.
Second, this wave is very sudden and much bigger in magnitude, particularly in the last week. This will translate to a longer tailing off in the months to come.
Third, a new trajectory is projected, one that is a lot steeper.
Yet again, this projection model works spot on...

INDIA COVID Wave incoming Update II Previously (see linked idea), the MACD model projected " a new wave should be approaching and happening in India in December 2021, going into 2022."
This was back in October 20, 2021
Just started as expected! Seen that the last week of 2021 and first week in 2022 is registering a spike, and a greater spike following.
Albeit the spike is not as pronounced yet, but expected as now we have Omicron. Back in October 20 at time of posting, Omicron was not yet identified. It was only made known in early December 2021.
Another example PROOF that the projection model works!
Going forward, it appears that serious acceleration of the spread should start end January and once February turns round.

INDIA COVID Wave incoming end 2021Based on the MACD Histogram projection model, a quick note that a new wave should be approaching and happening in India in December 2021, going into 2022.


Herd ImmunityA quick definition online gives "the resistance to the spread of a contagious disease within a population that results if a sufficiently high proportion of individuals are immune to the disease" describing Herd immunity.
I am not too familiar with the topic but I did learn it in school!
I think this is the best option for the world right now.

#Corona - #Covid-19 - From TA perspective those who trade crypto or bitcoin can clearly see on the chart we are in a PARABOLIC RUN.
Now every rally in the market comes to an end eventually but this one can be different, fundamentals can overpower technical here easily & we can just skyrocket to 10L, 20L.
we were in LOCKDOWN from past 2 months still numbers have gone higher & higher, this clearly shows that Govt have been CURBING the actual numbers, with strict Covid test rules, Not doing as many tests as necessary & sugarcoating the masses instead of facing the facts.
Now back to the chart as i said in the beginning the parabolic run comes to an end so i think 300000 will be the TOP for the current rally then we will have a retrace then some sideways & another leg up, MA & EMA are also giving support to trend, as it goes if we are in bullmarket price comes back to the MA & EMA's bounce to continue the trend.
YES I KNOW THIS FOR SURE THAT ANOTHER LEG UP IS GONNA BE MUCH MUCH WORSE THAN THIS, Govt is not giving FREE Covid Tests so what makes you think that when Vaccine arrives it will free? how many people will actually be vaccinated? How many people will be able to AFFORD it? apart from it think about the time it will take to actually vaccinate the highly populated country like India, it took well over 15-20 years to get rid of Polio from the country so you can imagine when we have a VIRUS that is highly contagious how long will it take.
i said this before this is the FIRST domino that has fell & much worse is expected from economy in coming years.
i honestly hope i am wrong (i said this back in 2019 - Dec) but here we are, charts never lie.
but we live in Real world & not fairy tales, it will be better if you ADOPT & learn how to survive then just HOPING THAT EVERYTHING WILL BE OKAY.
like every shitcoin we trade or stock we have charted there are cycles, same goes for the ECONOMY, it takes much much longer to pan out but after every BULL MARKET there is a Bear Market waiting around the corner. Everything ends & begin again.
Stay safe, Make sure if it's your last day then you have NO Regrets in life
🖖 🖖 🖖 🖖 🖖 🖖 🖖 🖖 🖖 🖖 🖖 🖖 🖖 🖖 🖖 🖖 🖖 🖖 🖖 🖖 🖖 🖖 🖖 🖖 🖖 🖖 🖖 🖖 🖖 🖖 🖖 🖖 🖖 🖖 🖖

Covid-19 Confirmed cases in INDIA analysis Covid-19 Confirmed cases in INDIA analysis
As You can see number of cases going high day by day & this Graph turned Parabolic .
In bearish scenario
If we are able to break Parabola then we can see less number of cases
steemitimages.com
In Bullish Scenario
if we are able to break 1/1 in this GANN then this is Heavily bullish & number of cases spike will be more high .
This chart only used for study Purpose .
if you like this chart give a thumbsup . Thanks

Stay Home.. Stay Safe..Health comes first.
Don't chase economy, chase health, economy will follow automatically.
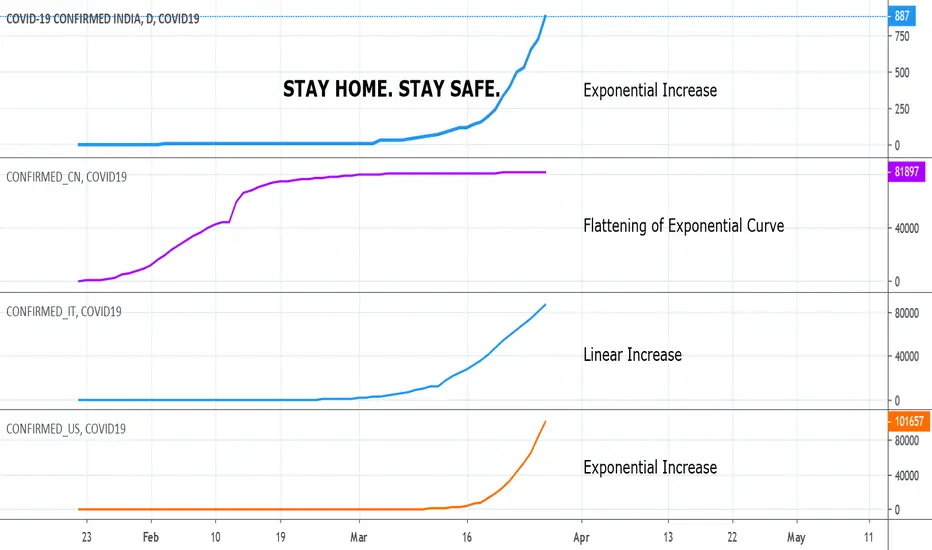
COVID-19Every Graph looks exponential except china. first graph is Total World cases, US cases, India Cases and China Cases respectively.
hope this (e power x) graphs ends soon.
