Potential Breakout Alert for #CROUSDT! Yello, Paradisers! Are you ready for some potential big moves with #CROUSDT? Let’s dive into the analysis to see what’s brewing!
💎#CRONOS is currently testing a resistance zone at $0.096906. If it manages to break above this level, there is a high probability it will embark on a bullish ride up to Resistance 1.
Additionally, we have observed #CRO following a descending channel for a long time. Recently, the price faced rejection, but interestingly, it is holding momentum above the EMA. This indicates a potential breakout above the descending resistance soon.
💎However, if the price of #CRO fails to hold momentum at this resistance, we expect a probable bullish rebound from the lower demand zone around $0.08718.
💎It's crucial to stay vigilant and closely monitor #CRO price movements. A breakdown below the demand area, confirmed by a daily closure, would challenge the bullish scenario and could result in further declines.
Strive for consistency, not quick profits. Treat the market as a businessman, not as a gambler. Stay focused, patient, and disciplined, Paradisers. This is the only way you will make it far in your crypto trading journey. Be a PRO.
MyCryptoParadise
iFeel the success🌴
CROUSDT trade ideas

Critical pointThe price of CRO is at a critical point. Breaking the $0.09380 resistance could trigger a strong upward move, while failing to do so may lead to a decline towards lower supports. Key levels to watch are the $0.09380 resistance and $0.08906 and $0.08810 support levels.

Cronos (CRO) - Bullish divergenceOn the above 6-day chart price action has corrected 92% since November 2021 @ 70 cents. A number of reasons now exist to be long, including:
1) Price action and RSI resistance breakouts.
2) Strong bullish divergence as measured over 60 days. 8 oscillators print positive divergence with price action.
3) Look left (orange line, best seen on 2-day chart) price action prints on historical support.
4) The macro bull flag forecasts a first wave target of 30 cents.
Is it possible price action could fall further? Sure.
Is it probable? No.
Ww
Type: trade
Risk: <=6% of portfolio
Timeframe: act now
Return: 400%

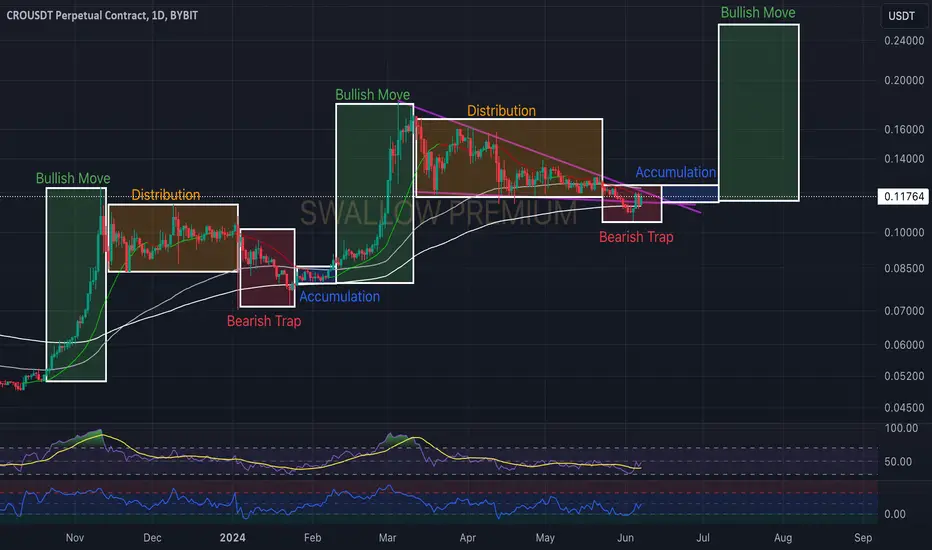
Crypto.com Coin (CRO): Entering Accumulation Phase?aA few of you asked for our view of CRO (after showing you one of our members, TA).
We see that CRO has similar patterns: Bullish zone, Distribution zone, Bearish trap zone, and Bullish zone.
We are now forming another Bearish trap here while also entering a zone of accumulation.
We see it that way; as long as we are above 200 EMA, we are good for another bullish movement here.
Swallow Team
CRONOS: THIS ALT can EASILY +100% From Here - CROUSDTCOINBASE:CROUSD
Cronos is an altcoin that I've been bullish on since the beginning for the year, and we've already seen our first two TP Point (Take Profit Points) hit, UP +40%.
The good news is that CRO still has HUGE upside potential, with the next TP +100% from where the price is currently trading in accumulation zone.
In the 4h, we see a clear reversal and turn towards the upside, indicating bullish momentum showing up in the short timeframes. This is as good as it gets buy zone, because we have just finished our correction and successfully retested the 50d Moving Averages in the weekly timeframe:
This could take some time to play out, but patience is your friend!
________________________________

CRO Macro Accumulation / Comprehensive AnalysisCRO just put in a bottom here, and I'm going to give you a full breakdown.
First, we have a macro Accumulation finishing up the last stages right before the markup. These have been playing out with huge pumps on many of the other altcoins, and this time we caught it very close to the bottom.
Next up, we have our Elliott Waves. CRO just finished retracing Wave 4 onto the top of Wave 1, which is perfect according to the EW rules. We should be seeing a Wave 5 up to $0.42662, which also coincides with a major monthly supply.
Finally, we have our ideal entries and take profit levels. I put in a market order since I believe we are already bottomed out, however if the price comes down any lower, here are my additional entries:
$0.1018, $0.09645, $0.8414, $0.07495
Our partial take profit levels on the way up:
$0.2317, $0.2637, $0.30, $0.3716
Follow us for more trade setups this altcoin season and make sure to come back and let us know how much you made on this setup!
-Pat
DigiLex, LLC
President & CEO

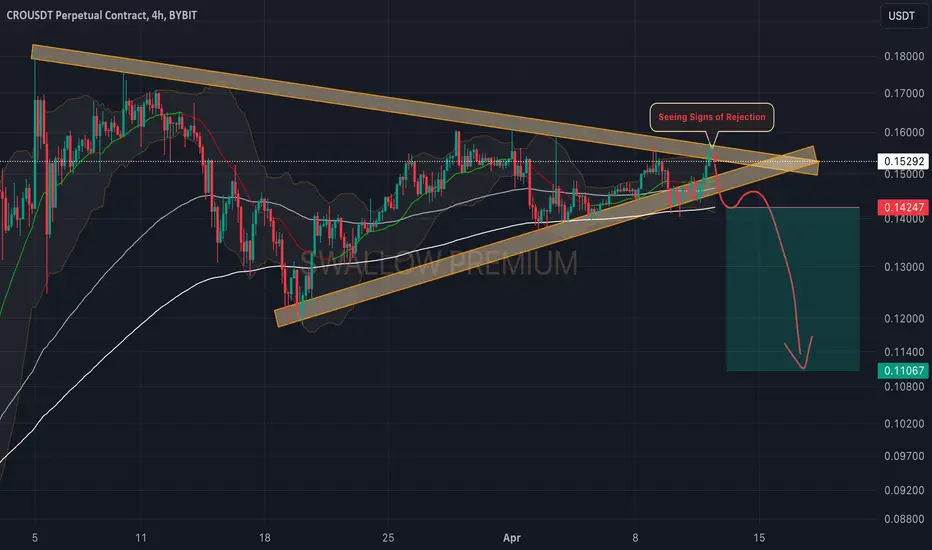
Crypto.com Coin (CRO): Good Bearish Scenario!Cro is looking pretty bearish to us, pressing heavily to breakdown from that triangle formation there.
The final confirmation would be of course breaking and securing that 200EMA, so this is our major point of interest!
Swallow Team

#CRO LONG IDEACro is still holding Daily support. Once we get a breakout and confirmation we should be seeing $0.20 soon.

#CRO/USDT 1W (Bybit) inverted Head & Shoulders breakout & retestCronos is pulling back to iHnS neckline support where 20EMA seems to be holding, looks like a great swing opportunity on weekly.
⚡️⚡️ #CRO/USDT ⚡️⚡️
Exchanges: ByBit USDT
Signal Type: Regular (Long)
Leverage: Isolated (1.0X)
Amount: 4.8%
Current Price:
0.12591
Entry Targets:
1) 0.11822
Take-Profit Targets:
1) 0.26475
Stop Targets:
1) 0.0693
Published By: @Zblaba
CRYPTOCAP:CRO #CROUSDT #Cronos #PoS crypto.com
Risk/Reward= 1:3.0
Expected Profit= +123.9%
Possible Loss= -41.4%
Estimated Gaintime= 3-6 months

CRO to 0.12860CRO bounce to 0.12860. The labs took the trade.
This is based off of a weekly gap and daily gap.

WHEN to BUY CRONOS - Using BTC.D 🔁BITTREX:CROUSDT
As seen from the CROUSDT chart, the Bitcoin Dominance Chart reveals many secrets when overlayed onto your altcoin chart.
They key reason for this being the constant rotation of money in and out of Bitcoin, and into and out of altcoins. If you're looking for a more detailed explanation on when to buy altcoins, check out yesterday's update here:
From the chart we can clearly see that Cronos has bottomed out, but is struggling to regain bullish momentum. As we overlay the BTC.D chart (yellow) we can see there is a negative correlation between the two - When BTC.D drops, CRO increases. And when BTC.D increases, CRO drops. This will hold true not only for CRO , but for other smaller market cap altcoins as well.
This concludes that NOW is an excellent zone to buy Cronos, as the price is yet again in accumulation zone. An increase can be expected as soon as we see a dip in Bitcoin Dominance.
______________________
CRYPTOCAP:BTC.D

Crypto.com (CRO): Price Is Under Pressure / Potential Breakdown We are back with Crypto.com coin, where we see a good chance for a breakdown to happen.
We are seeing that while the price has been bouncing nicely from the bullish trend, we also have been seeing a few fakout zones near 200EMA.
As we see multiple failed attempts to breakout from EMAs we have not yet seen any attempts for potential breakdown from trend...which might happen soo, as we are under pressure now from both trend and 100&200EMA lines!
Swallow Team

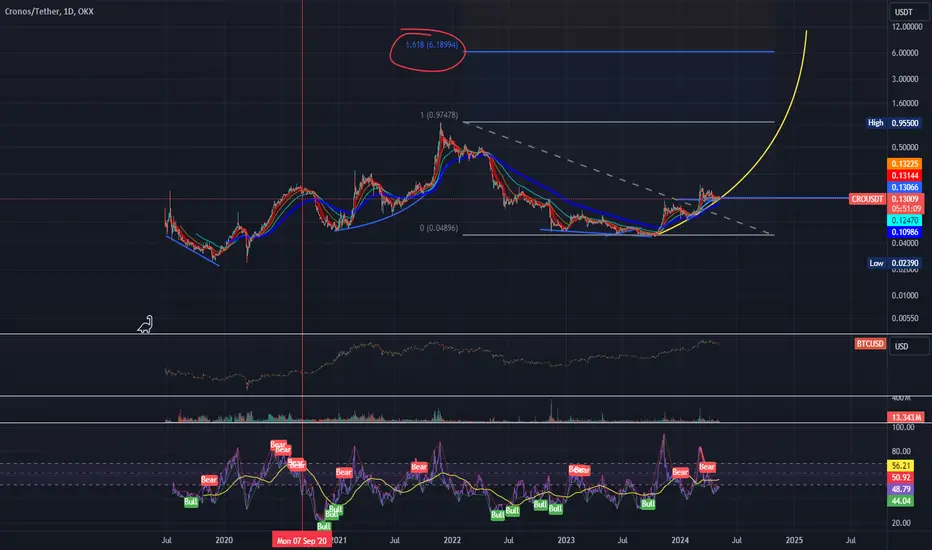
Cronos CRONowadays Cronos still has nice parabolic support (yellow line).
Its strong exchange coin, if we will be still in Bitcoin bullrun then $6 can be CRO top.
CRO's Correction PhaseThe price of CRO has reacted after encountering the second resistance level and has entered a correction phase. It is important to note that if strong bullish and reversal patterns emerge, there is a possibility that the price may resume its upward trend and reach higher targets.

CRO: Watch THIS ALT for x100 in ALTSEASON📉Hi Traders, Investors and Speculators of Charts📈
We observe an important pattern on Cronos in the Daily - the Flag Pattern, also known as the Pennant. The pennant can be either bullish or bearish, depending o where the price CLOSES.
The BULLISH Scenario / Long:
The BEARISH Scenario / Short:
From a technical indicator perspective, the MACRO is still clearly very bullish:
If you found this content helpful, please remember to hit like and subscribe and never miss a moment in the markets.
_______________________
📢Follow us here on TradingView for daily updates📢
👍Hit like & Follow 👍
CryptoCheck
CRYPTO:CROUSD

Crypto.Com Coin(CRO): Looking Sweet For Drop (MIGHT)The CRO coin caught our attention with its price being stuck in the end phase of the triangle formation, which indicates a potential liquidity movement.
We are seeing a good sign of weakness right now, and we are looking at the same time at that 200 EMA (which we want to see tested and broken).
The game plan is clean, I think, so let's see.
Swallow Team
✅ NEW TRADE REVIEW: $CROUSD- CROUSDT is buyable through a tight pibot near the low
WHAT I LIKE IN THE CHART
- Had +150% powerful move up
- Great volume charactersitics
- Tightening down with lowering volume
WHAT WOULD BE A NORMAL TURN OUT FOR THIS STOCK
- A normal behaviour would indicate a push higher to the organge box, named 'CONSOLIDATION' withouth increasing volatility (aka without moving below the Stop Loss red dotted line)
- This is great place to START a position (not whole but a quarter of position size (e.g. if you full position size is $25,000, it is a good place to start with $5,000-8,000)
NEXT Technical buy point is a consolidation in the box and breakout there
The risk is less than 5% on the trade. As the stock moves up, it is important to keep managing the risk reward relationship
DISCLAIMER:
THIS IS NOT FINANCIAL ADVICE. ONLY FOR EDUCATIONAL PURPOSES TO ILLUSTRATE TECHNIQUES

CRO BUY -It will hit the minor support level, hence I beliebe it will bounce back at least 1.5%.
I am not an expect but was learning a lot recently, lets see if it will happen.

CRONOS - WEEKLY ...2x?CRONOS - WEEKLY ...2x?
For me , this chart is bullish.
New highs with HL's in progress.

Dragon Fly Doji on Cronos CROThere is a dragon fly doji printed on the bottom of a downtrend, with a very long wick towards up price. Followed by a super green candle that if stays the same in 4 days, we are in for the next FIB level which is 27 cents. Currently 15cents

CROUSDT shortlooks like OB test as flat wit swip/deviation on top. Swip down not as shadow, but with small reswip. Some liquidity is on the bottom to swip/go down

CRO/USTD bullish reversal from support? 👀 🚀CRO analysis💎 Heads up, Paradisers! #CROUSDT is on the brink of a bullish shift, eyeing a rebound from the critical support at $0.12303. If it keeps up the momentum here, we're likely to see a bullish journey, given this level has held firm three times before, underscoring its reliability as strong support.
💎 Should the climb of #CRO start to falter and dip below $0.12303, we'll turn our attention to a vibrant demand zone at $0.10938. With ample liquidity awaiting, there's a solid chance for a bounce back from this pivotal level.
💎 Alertness is essential: a breach below this lower support could signal a deeper slide, as market sentiment may swing towards a sell-off. Stay on your toes, traders, as we navigate through #CRO's market shifts.

CRO TargetsCrypto.com has managed to stay solvent, relevant and continued building throughout the bear market. Despite questionable actions, such as abrupt announcements, laggy applications and high spread on the mobile application; The exchange currently feels really good, and the app is constantly getting updates.
Of course, it is a shame that the perks of Indigo/Jade is pretty non-existent now, however I believe it is to encourage them to HODL for the next tier, locking in CRO = no panic sells despite market conditions.
Anyways,
TP1: $0.33
TP2: $0.85
TP3: $2.17
Thank you for reading my post. Have a great year ahead!
