NATYY Bullish H&S StructureQuite clear H&S shoulder pattern has developed on NATTY which began accumulating at the beginning of March of this year.
The green rectangle is the base of the massive accumulation zone which has acted as support previously, now turned resistance.
There's been 2 prior attempts at breaking throu

NATGAS BuyNatgas is again approaching the usual support level around 1.613.
I think we can't go any lower than that, so it might be worth taking a long position.
The lowest possible can be 1,566.

Maturity of the bullish market, any correction pattern extends tEsteemed analysts and traders,
I hope this correspondence finds you in good health and high spirits, prepared to tackle the upcoming week with renewed energy. I extend my best wishes for your continued success in all your business endeavors. It is worth noting that success in trading is largely dep

Natural Gas & Oil ready for big moves? Natural Gas adn equity stocsk saw some positive flows on Friday despite tremendous market weakness.
The commodity sector has been hot and Nat gas has still lagged by a large margin.
Nat Gas still trying to break out of a potential stage 1 basing formation.
This base could be a powerful move to


NGas is BullishI am expecting a continuation according to HTF and a high propability of a bullish movement after mitigating the FVG .
Happy trading.

Natural Gas April 22, 2024: Waiting to Break Above the ResistancOn April 22, 2024, CAPITALCOM:NATURALGAS is trading below the resistance of 2.04 - 2.05 (yellow line) from Feb 6, 2024, with 3 bottoms forming as shown on the chart.
A break above this resistance would trigger a buy signal with the target around 2.45 as shown on the chart, the same distance to t

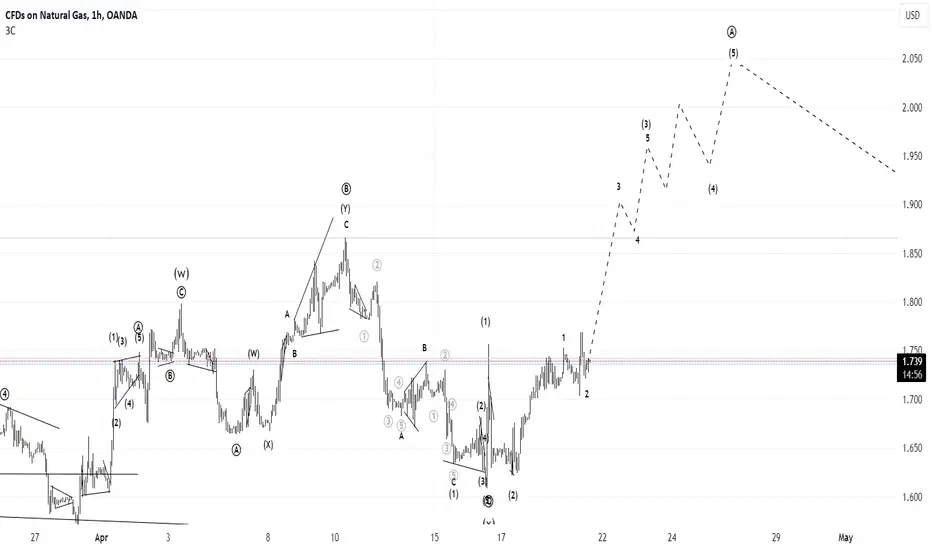
Natgas UpdateSeems like natural gas is ready to explode in 3rd of 3rd Elliottwave. Oil has similar sentiment despite being less obviously bullish. Natural Gas remains so far firmly on track and expected to rise with oil, perhaps on the Middle East escalation in the most nearest future.
Natural gas long viewThe price of gas is moving away from the previous bearish trend. January and February were extremely bearish. March was a month of consolidation, and April initiated a bullish consolidation supported by EMA20 and EMA50 daily. The price is currently at the $2.05 level, and before the next bullish run

NATURAL CallsLooks like Natural Gas is trending in a channel and just landed on the its support area. Theres a high probability the price will reverse from this area as its been consolidating there for quite some time now.

See all ideas