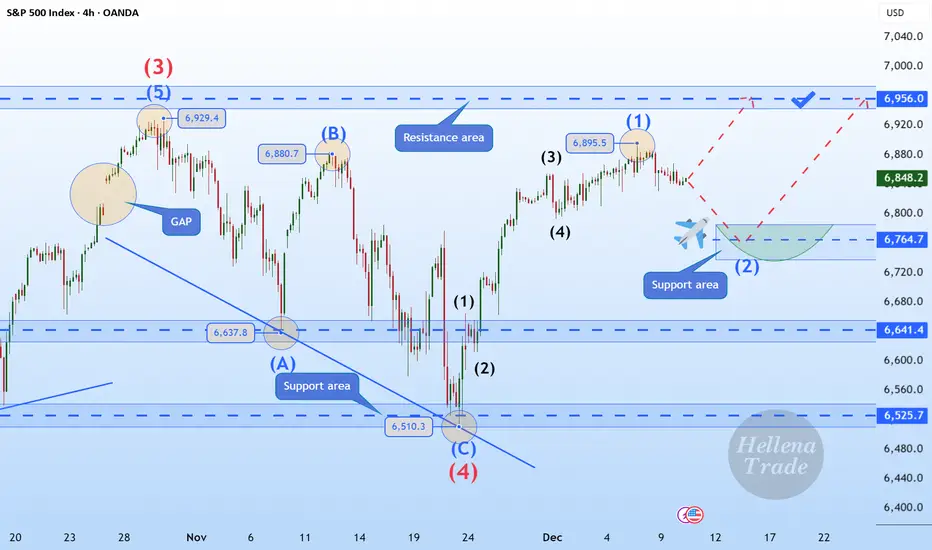
Hellena | SPX500 (4H): LONG to the area of 6956.Hello, colleagues!
I previously published a forecast for an upward movement, and I believe it is time to update the plan slightly. The direction of movement remains the same, but wave “1” has lengthened, which means that the correction in wave “2” may occur slightly higher than previously.
I expec
S&P 500 Index
No trades
About S&P 500 Index
Standard and Poor's 500 Index is a capitalization-weighted stock market index measuring the performance of 500 large publicly traded companies in the United States. This index covers a wide range of industries, including technology, healthcare, energy, and finance. It serves as a benchmark for the overall health of the U.S. stock market, as well as a reflection of the country's economic strength.
Substantial gains in the S&P 500 are often interpreted as positive signals for the economy, while losses can be seen as indicators of potential trouble. Investors use this index as a barometer for their own portfolios and to assess the performance of individual stocks. The S&P 500 index plays a vital role in the financial world and is closely watched by analysts and policymakers.
Substantial gains in the S&P 500 are often interpreted as positive signals for the economy, while losses can be seen as indicators of potential trouble. Investors use this index as a barometer for their own portfolios and to assess the performance of individual stocks. The S&P 500 index plays a vital role in the financial world and is closely watched by analysts and policymakers.
Related indices
S&P 500 to 10,000 inside the next 4 years - December 2025** This is an outlook for the next 3 to 4 years **
** The bull market is not yet done, sorry bears **
Yes, read that right, 10,000 or 10k for the S&P 500.
The markets shall continue to grind higher during this 10-year bear market everyone is talking about.
Upwards and onwards for investors as u

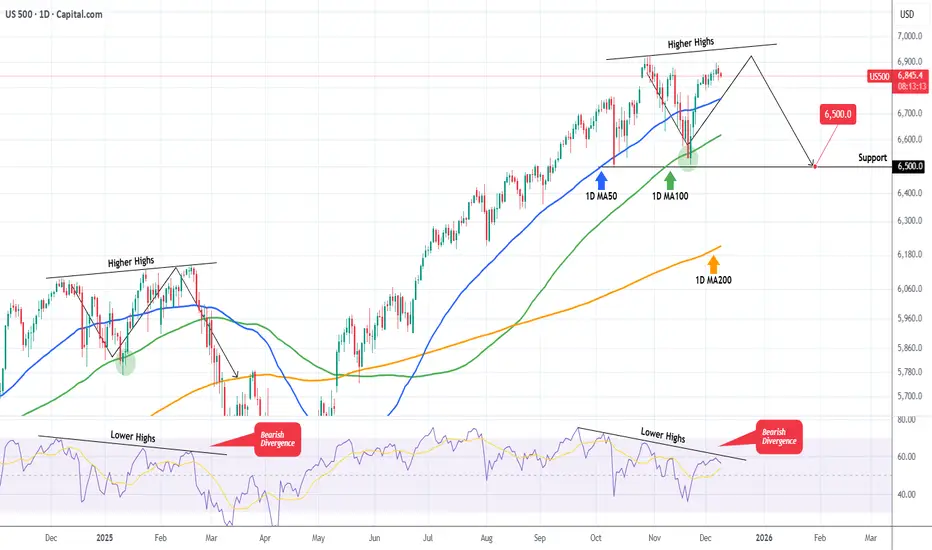
S&P500 The Bearish Divergence that may spoil the party.S&P500 (SPX) is extending a strong rally following the rebound on its 1D MA100 (green trend-line) almost 3 weeks ago. As we pointed out in a previous analysis, the price action of the past 2 months has been identical to the pattern after November 19 2024.
We are currently on the same 1D MA100 rebou
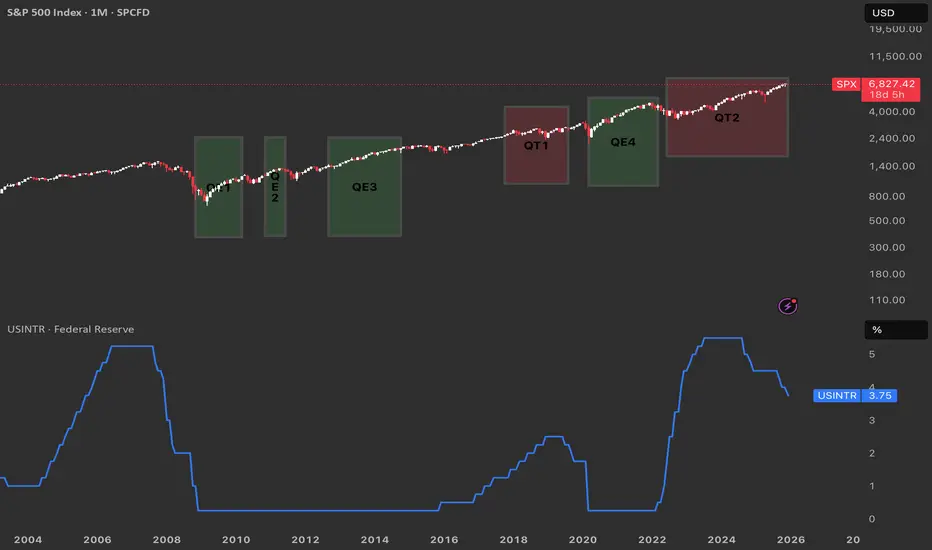
From QE to QT. Reading the Fed’s Cycle from the ChartQuantitative Easing (QE) is when the Federal Reserve buys large amounts of Treasuries and mortgage‑backed securities to expand its balance sheet, inject liquidity, and push interest rates lower across the curve.
Quantitative Tightening (QT) is the opposite: the Fed allows its bond holdings to
S&P 500 Breakdown Alert — Rising Wedge Reversal in Play!Today I want to share an S&P 500 index( SP:SPX ) analysis, as this index plays a major role in guiding correlated markets—especially crypto, and particularly Bitcoin( BINANCE:BTCUSDT ).
The S&P 500 index entered the Potential Reversal Zone(PRZ) and resistance zone($6,902_$6,875), where it began to

The Retail Trend-Following MythThe Illusion of Simple Profits: A Quantitative Analysis of Moving Average Trend Following Strategies and the Gap Between Retail Mythology and Institutional Reality
The proliferation of retail trading education has created a widespread belief that trend following through moving average crossover sy

S&P500 Points Toward 7,500—But the Path Won’t Be a Straight LineS&P500 remains structurally bullish on the higher timeframes, and the broader geometry continues to point toward the 7,500 area as a long-term magnet.
However, the market never moves in a straight line — corrective phases, pullbacks, and rotations are a natural part of the path toward higher levels.

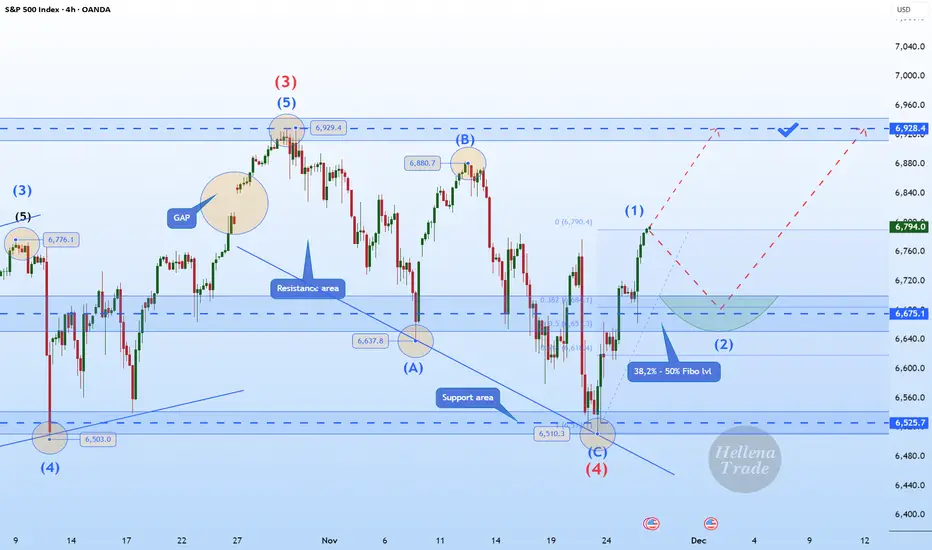
Hellena | SPX500 (4H): LONG to MAX of wave "3" of 6928.Colleagues, we continue the previous scenario of upward movement in the impulse “12345”.
I expect a small correction in the middle order wave “2” approximately to the area of 38.2%-50% Fibonacci levels (6675).
Then I expect a continuation of the upward movement to the maximum of the wave "3" of the
S&P 500: Last Bullish Push
On the medium-term horizon OANDA:SPX500USD AMEX:SPY CME_MINI:ES1! still looks like a clean impulse:
Wave 3 shows a classic extension
Wave 2 is a sharp zigzag
Wave 4 has the structure of a flat – a running flat on S&P, while Nasdaq 100 forms something closer to an EFL
Connecting waves 1–3 an

SPX500 | Bulls Target 6957 as Breadth Improves Beyond AISPX500 – Technical Overview
The S&P 500 has reached a new record high, notably without support from AI-related stocks.
Despite underwhelming earnings from Oracle and Broadcom, the broader market continued to rally—an encouraging sign that sector leadership may be broadening rather than relying sole

See all ideas
Summarizing what the indicators are suggesting.
Oscillators
Neutral
SellBuy
Strong sellStrong buy
Strong sellSellNeutralBuyStrong buy
Oscillators
Neutral
SellBuy
Strong sellStrong buy
Strong sellSellNeutralBuyStrong buy
Summary
Neutral
SellBuy
Strong sellStrong buy
Strong sellSellNeutralBuyStrong buy
Summary
Neutral
SellBuy
Strong sellStrong buy
Strong sellSellNeutralBuyStrong buy
Summary
Neutral
SellBuy
Strong sellStrong buy
Strong sellSellNeutralBuyStrong buy
Moving Averages
Neutral
SellBuy
Strong sellStrong buy
Strong sellSellNeutralBuyStrong buy
Moving Averages
Neutral
SellBuy
Strong sellStrong buy
Strong sellSellNeutralBuyStrong buy
Displays a symbol's price movements over previous years to identify recurring trends.
Frequently Asked Questions
The current value of S&P 500 Index is 6,827.42 USD — it has fallen by −1.07% in the past 24 hours. Track the index more closely on the S&P 500 Index chart.
S&P 500 Index reached its highest quote on Oct 29, 2025 — 6,920.34 USD. See more data on the S&P 500 Index chart.
The lowest ever quote of S&P 500 Index is 2.73 USD. It was reached on Jun 1, 1877. See more data on the S&P 500 Index chart.
S&P 500 Index value has decreased by −0.57% in the past week, since last month it has shown a −0.59% decrease, and over the year it's increased by 12.40%. Keep track of all changes on the S&P 500 Index chart.
The top companies of S&P 500 Index are NASDAQ:NVDA, NASDAQ:AAPL, and NASDAQ:GOOGL — they can boast market cap of 4.25 T USD, 4.11 T USD, and 3.74 T USD accordingly.
The highest-priced instruments on S&P 500 Index are NYSE:NVR, NASDAQ:BKNG, and NYSE:AZO — they'll cost you 7,517.81 USD, 5,301.64 USD, and 3,445.71 USD accordingly.
The champion of S&P 500 Index is NASDAQ:SNDK — it's gained 488.08% over the year.
The weakest component of S&P 500 Index is NASDAQ:TTD — it's lost −72.57% over the year.
S&P 500 Index is just a number that lets you track performance of the instruments comprising the index, so you can't invest in it directly. But you can buy S&P 500 Index futures or funds or invest in its components.
The S&P 500 Index is comprised of 502 instruments including NASDAQ:NVDA, NASDAQ:AAPL, NASDAQ:GOOGL and others. See the full list of S&P 500 Index components to find more opportunities.