CVCUSDT UPDATE #CVCUSDT
UPDATE
Hey dear traders hope you are enjoying trading and analysis with our team. we are here to discuss about CVCUSDT
CVC is getting good volume with support ✅
In the case of successful breakout Expecting 80-90% profit🚀
CVCUSDT trade ideas

+++++ CVCUSDT UNIQUE IDEA %%%%%%#CVCUSDT
UPDATE
CVC has breaked the main Falling Wedge Pattern. Getting here a good volume. We can see gain here upto 70%+ soon ✍
#CVCUSDT BUY @ 0.1850
TP1 @ 0.1950
TP2 @ 0.220
TP3 @ 0.290
SL @ 0.1500
Note:- Falling Wedge breakout done. Use exact entry or above that level.

Civic (CVC)On the above 4-day chart price action has corrected 90% since the sell signal in February 2021. A number of reasons now exist to be long, including:
1) You know why..
2) Price action and RSI resistance breakouts.
3) Strong positive oscillator divergence with price action. Multiple oscillators currently print bullish divergence with price action over 136 days.
4) Point (3) prints on the golden ratio, which is also past support. Look left.
Is it possible price action corrects further? Sure.
Is it probable? no.
Ww
Type: trade
Risk: 6%
Timeframe: 1-2 weeks to open
Return: will say somewhere else

CIVIC (CVCUSDT) Surges 200% in Price, Further Gains PossibleCIVIC (CVCUSDT) has experienced a phenomenal surge in price today, skyrocketing a staggering 200%. The price, which was previously hovering around $0.10, has broken free and reached a new high of $0.30
A possibility of further price gains, with some predicting a breakout if the monthly candle closes above $0.41. In this scenario, the price could potentially reach $0.60.

CVC/USDT Can Rally if it Holds the Below Support Level👀🚀💎Paradisers, be on high alert! #CVCUSDT is poised for a compelling opportunity as it prepares to retest ascending support, indicating a robust bullish move ahead.
💎We've observed #CIVIC consistently respecting an ascending support line on the 1D timeframe, suggesting a solid foundation for bullish potential. Currently, it's approaching the crucial support level at $0.1329.
💎If it holds steady here, there's a strong likelihood that it will target the significant resistance at $0.24, with the RSI hinting at a possible upward trajectory, adding weight to this bullish perspective.
💎Conversely, if #CVC loses momentum and breaks below this key support, be ready for a bullish rebound from a lower Demand Zone at $0.113. A slip below this level would indicate a marked downward trend for $CVC. Keep your strategies flexible and stay sharp for any market fluctuations.

#Cvc#Cvc
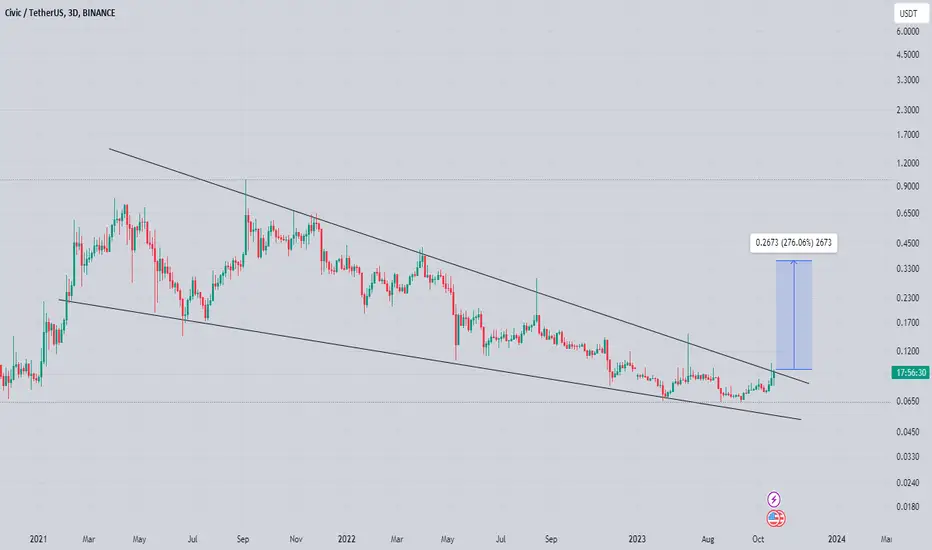
For a year and a half, we have been in a downward wave within a strong descending triangle
We see the beginning of a breakthrough in prices and the beginning of an upward trend
We expect the downtrend to be broken in the next few weeks, which supports the idea of a strong rise
We expect an upside of 200-220% in the mid-term
Support points and targets are shown on the chart

CVC/USDT📈SIGNAL
COIN : BINANCE:CVCUSDT
CEX. : #BINANCE - SPOT
➖
ENTRY : 0.1082
➖
TARGETS :
T1 : 0.1168
T2 : 0.1259
T3 : 0.1369
T4 : 0.1939
➖
STOP : 0.1022
➖
⚠️WARNING:
• I'm not a financial advisor.
• Do your own research (DYOR).
• And Don't forget risk management.
➖
💡For investors:
1- Enter the trade with 10% to 20% of your capital to reduce risk and save cash to enter other opportunities.
2- Sell (25% to 50%) on (T1) and don't move your stop-loss.
3- Sell 50% on (T2) and move your stop loss to the entry point.
4- You are safe now, and the next 25% is up to you.
5- Stop is activated. When one candle closes below the stop level of the same time frame of the signal.
➖
💡For intraday scalping:
1- Enter the trade with 10% to 20% of your capital to reduce risk and save cash to enter other opportunities.
2- You can close the trade at the first target.
3- Stop loss is direct without waiting for the candle to close.
➖
💡Reason for this trade:
BINANCE:CVCUSDT gives my trading system a sign of strength:
1. My trading system is based on liquidity and reversal zones.
2. When the liquidity is swept from one side under certain conditions, we will wait for the price on the other side.
The liquidity will attract the price like a magnet.
➖
• the first side that has been swept:
A- strong liquidty pool
B- reclaim valu area high
➖
• Opposite side targets:
A- equal high
B- FVG
C- liquidty void
➖
💡Entry setup
A- reclaim mid range + valu area high

CVCUSDT UPDATEASX:CVC
UPDATE
ASX:CVC is making bullish pennant pattern and almost breakout done. Here we can see gain upto 70%+ soon
#CVC #CVCBTC #CVCUSDT #CVCBNB #USDT #CRYPTO #SIGNALS


CVCUSDT IDEAHello Traders Hope You Are Enjoying Our Analysis. Today We Will Discuss About CVC
(Update)
Finally Hit Our Target✅
Running In +140% Profit So Far✍️
We Earned Good Profit From #CVC⚡️

CVCUSDT(Civic) Daily tf Range Updated till 26-03-24CVCUSDT(Civic) Daily timeframe range. pretty good performance from this one. i had a position from 0.1923 played out very well. not much of pushback here at 0.3201 depend on swing sellers. gaining upperhand from 0.3201 can give it a good advantage.

CVCUSDT IDEAHey traders hope you are enjoying our analysis. Now we are here again with a new trading opportunity. We will discuss today about CVC
CVC Moving As Expected & Running In 140% Profit So Far✍️
Expecting 300% bullish wave in Coming days 🚀

Falling Wedge Pattern with Key Zones IdentifiedHello beautiful people,
Today, we are observing a potential bullish reversal setup in the CVCUSDT trading pair, primarily governed by the classic "Falling Wedge" pattern. Here are the important level to watch for:
The pair is trading within a distinct falling wedge pattern, which is typically perceived as a bullish reversal signal post a downtrend. The converging trendlines, both slanting downwards, are becoming closer, indicating a potential breakout soon.
There's a conspicuous area within our chart acting as a robust zone for long positions. This region, backed by historical data, indicates strong buying interest. Observing the volume can give further clarity on the accumulation.
Above our current trading level is the liquidation clearance zone, which may cause some resistance. This area is anticipated to have considerable selling activity, especially from traders who were previously short and might face liquidation as the price ascends.
For those considering an entry, a prudent stop-loss would be slightly below the lower trendline of the falling wedge or beneath our identified accumulation zone. Always remember to adjust stop-loss based on real-time data and risk appetite.
As always, perform your own due diligence and use appropriate risk management.
Happy trading!

CVCUSDT IDEAHey traders hope you are enjoying our analysis. Now we are here again with a new trading opportunity. We will discuss today about CVC
CVC Breaking Falling Wedge In Weeklt Timeframe Successful Breakout Can Lead 300% Bullish Wave In Coming Weeks✍️

CVCUSDT IDEAHello Traders Hope You Are Enjoying Our Analysis. Today We Will Discuss About CVC
(Update)
The Falling Wedge Has Confirmed Breakout In WEEKLY Timeframe Chart
Moving As Expected & Running In +40% Profit So Far🔥
Still Moving Towards The Target & Hit Out Target 0.3000 Soon📈

CVC LOOKS BULLISHWe have had a large diametric that appears to be the end of the G wave of this diametric, which is itself a diamond diametric.
By maintaining the green range, it can move towards the targets.
Closing a daily candle below the invalidation level will violate the analysis.
The targets are clear on the chart.
For risk management, please don't forget stop loss and capital management
When we reach the first target, save some profit and then change the stop to entry
Comment if you have any questions
Thank You

CVCUSDT IDEAThe Falling Wedge Breakout Is Confirmed In WEEKLY Chart✅
Expecting a 150-180% Bullish Rally🚀✨

CVCUSDT IDEAHey traders hope you are enjoying our analysis. Now we are here again with a new trading opportunity. We will discuss today about CVC
CVC Falling Wedge Breakout Has Already Confirmed Retesting In Process Incase Of Successful Retest Expecting 3-4x Bullish Wave In Coming Weeks Waiting For Perfect Retest

Bullish trend to fill the gapAccording to my analysis, we have just witnessed a sweep. To continue the bullish trend, get ready to go TO THE MOON to reach 0.3.

CVC on the moveWith formidable volume and two buy prints I expect more profits
Next stop 0.20 and above
DYOR

CVCUSDT UPDATE
Civic (CVC) is an Ethereum token used to power Civic's identity verification protocol. Users who verify their information through Civic can then securely share both their info and the verification with service providers, reducing the need to constantly re-verify their identity.
Prediction:-
CVC is at a strong support level after breakout. Here we can see gain upto 200%+.

CVCUSDT IDEAHello Trading view Family / Fellow Traders.
I hope you have used and benifited from the previous analysis .
In today trading session we are monitoring CVCUSDT for a buying opportunity...
CVCUSDT UPDATE
Cvc is ready for a good bullish wave in this move we can see price around 0.1300.
Moving As Expected Running In 65% Profit ✍️

cvc on verge of massive breakout on verge of massive breakout and getting ready for solid recovery in midterm
formed falling wedge in 3 days tf and testing descending trendline expecting massive breakout soon incase of successful breakout expecting 200 to 220% bullish rally