DFMGI trade ideas

DFM What Happen TodayAfter a breakout usually market rallies but today was somewhat opposite. The small resistance of 2090 pushed market down its bit surprising. Any how there is still potential to go higher from here, there are good chances of crossing 2100 tomorrow and the rally continues to upside. On the other side if the market comes back into the triangle range thn scenario will change this will indicate bulls are not strong and not ready to fly yet. I am still bullish and i think market will push it to upside tomorrow.
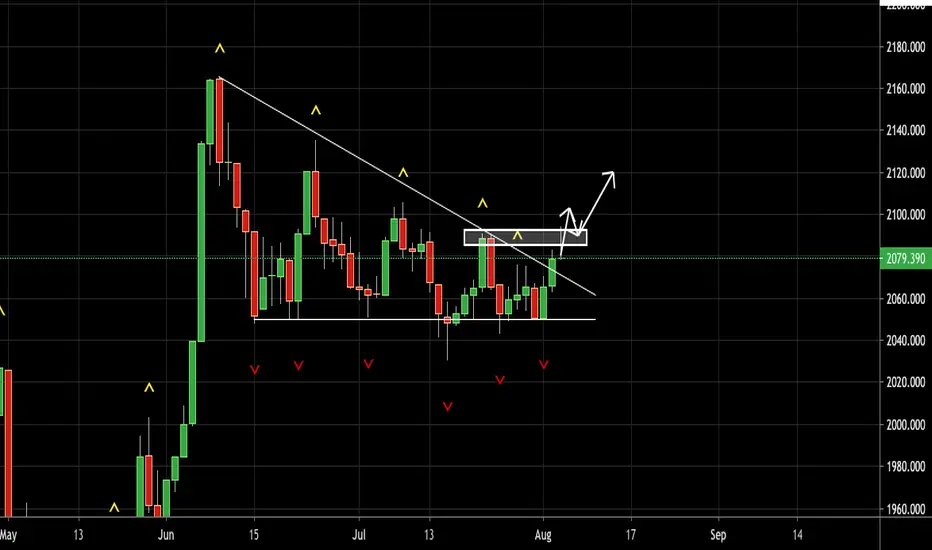
DFM Finally Did It Breakout??Yes it have broken the trend line today after so many days and closed in 2078 area. It will be very interesting to see tomorrow if it is coming down to retest 2070/75 area and bounce off. This can be a bull trap too lets analize if this is a fake breakout just to trap the bulls it will come back again in the triangle and continue to range. If we go back few weeks on 15th august exactly it broke down the triangle range and got back into the triangle very next day it was a bear trap!
If this breakout is confirmed tomorrow market will quickly move up and first target will be 2200 level and 2050 and thn 2400 respectively. So tomorrow is the D day lets stalk closely to take out trading decisions. I am bullish for sure.
Hit like & follow

Market BouncedNo doubt that 2050 is the most watched area, buyers are sitting right at 2050 the moment market touches this level market is pushed up. Its still within the triangle range and eventually give a breakout to either side. I am bullish and expecting it to break to upside. Triangle is almost ripe and it getting ready to breakout we will soon see a breakout. Bullish for now.
Hit like & follow to show your support guys
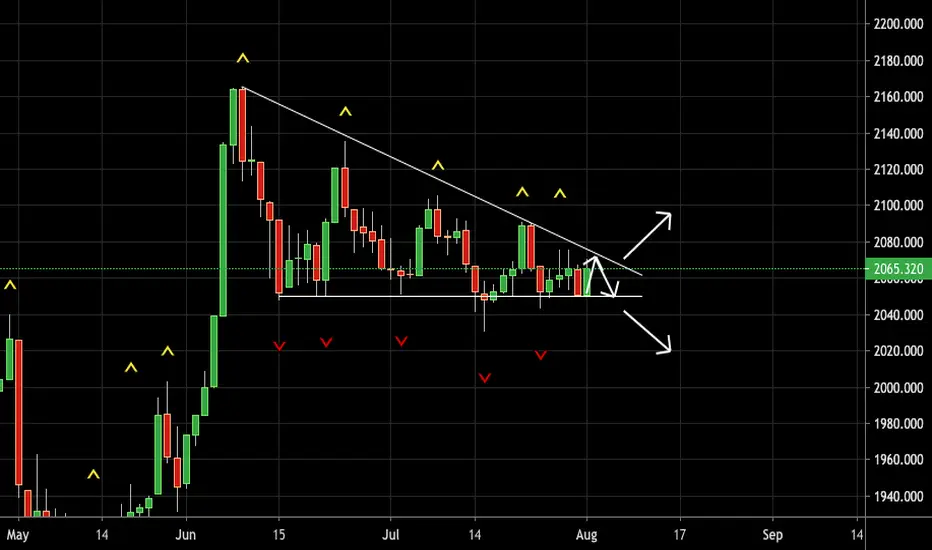
DFM Again Same PlayIts done it again, its in the triangle range it almost it the upper range during the early hours of trading and the its fizzled out to close at 2061. We are still within triangle lets stalk closely as we are nearing to the breakout. It would be so exciting to see on which side its breaking. I think it should break to upside. Bullish for now
I will update my stock picks for tomorrow in a video soon. Keep stalking :)
Hit like & follow guys.

Dubai Financial MarketAs per our trade plan market is still stuck in a triangle range and have bounced off from the crucial support area by now we know 2050 is important level for the market and its closing above 2050. It would be very interesting to see which side it gives a breakout. I am still bullish as the market is above 2050 level. I think either this week or max next week we should see a breakout.
Hit like & follow

Dubai Financial Market What nextThis one too is playing as per the plan, market is stuck in the triangle range as i had mentioned in my early idea. If you are following me on insta i had mention how it will perform today and it did the same thing. Its just that the market behaved as per the trade plan. We cant me 100% correct everytime we just have to be correct and successful atleast 60% of the time to be a successful trader. Market can break either of the side with big move expected. Keep stalking this one!!
Hit like & follow guys

Dubai Financial Market Upside or Downside?A small education video on trend analysis on Dubai Financial Market.

Dubai Financial MarketMarket is going as per the plan, its still in the triangle and it did touch 2050 level again today the retest and bounced off to close at 2064. Slow and steady moves but yes it inching slowly upwards within the triangle range. It will be very interesting to see where does it breakout. Lets wait and watch. Keep stalking.
Hit like & Follow

DFM Bounce BackGood starting of the week with positive closing, market have bounced back again ! bulls have show some power and the market have pushed upside the move is small but still its back in the positive side or the triangle as marked in the chart. The pattern still continues and is valid we can expect market to move up till the next resistance inside the triangle and it will give a breakout at the apex which is not coming closer, we can expect a break out by end of this month. Let wait and stalk to which side it gives a break out. Market is back in the safe zone which is bullish. I took a trade on Damac will post my trade too.
Hit like & follow guys!

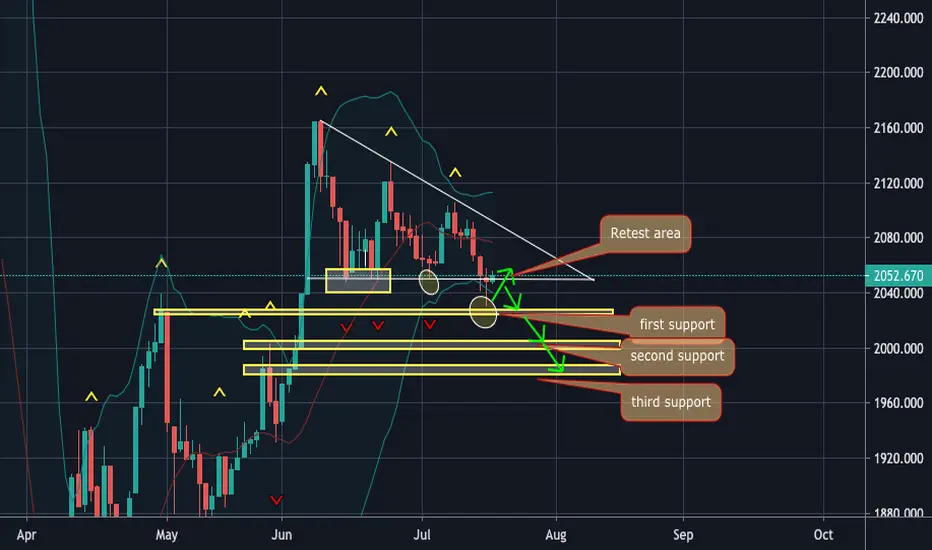
DFM On A Bigger PictureIf we shift our charts to weekly and have a bigger picture we can easily identify a uptrend, the market is making higher lows and higher highs that is a proper definition of a uptrend. As of now its at very critical support area if it breaks to down side the next support area is 1890 area and 1720 area respectively. If the market have to go up from here bulls have to act fast and this week, if the market goes below this level at the end of the week we can say shift in the trend is taking place and further selling pressure can be witnessed. As a day trader i am bearish on this one but for a long term trader it can still be bullish. Lets stalk this one for the coming week to have a idea about the trend.
Hit like & follow if you like my analysis.

DFM Weekend ReviewInteresting week again, thursday we closed in green so is the selling pressure finished? lets analyze in details. Market is trading in a range and have developed a triangle as marked in the chart. It is making lower highs and it made a new lower low on wednesday and closed with a hammer like candle. My analysis says market is very weak and thin it have almost broken the triangle pattern to the downside and in thursdays trading session we didnt witness any strong buys coming in to rescue the selling pressure through out the week. It did make a small green candle but that was just a up day in a down trend nothing significant yes it closed above 2050 but the chart damage is already done. Now from here it can also come back in the triangle and start to go higher but chances are slim as its becoming bearish day by day. It can go up to 2060 and retrace back or continue down from 2050 levels itself.
For this to become bullish buyers have to make tremendous efforts to bring the market above 2100 level which will show a shift in the momentum and become bullish. There are few shares that are still bullish and in trend i will soon post them on my insta and keep you all updating. Its looking bearish for now.
Hit like & support to show your support.
FInally its done it!Interesting session today, it finally broke down today and tried to retrace back to close above 2050 level but it could not. As i mentioned yesterday the market is getting weaker and weaker as this support level of 2050 have been tested more thn 3 times and now its become weak. Today it went down till 2030 and bounced from there but its already done the damage. It has a chance to retrace a little more tomorrow but over all it have turned bearish and a reversal is taking place. Detailed analysis will be done over the weekend.
Hit like & Follow to show your support.

DFM playing Games?It almost broke the support level today of 2050 and bounced back, If it had closed below the support level it would turn bearish and a reversal would take place however it closed at 2050 and respected the support level by giving the correct reaction. This is the 5th time it have tested this level and successfully reacted in a positive way. Any support or resistance tested again and again becomes weaker.Today it went down to 2041 and bounced yes we can call this a fake breakout out to down side anyone who panicked & sold their stocks must be regretting so who was buying today? surely the "SMART MONEY" they bought the stocks today at the cheaper price to sell it at higher prices. Market is above 2050 level i am bullish.
Hit like & follow

When is the breakout ???Market is stuck in a descending triangle as marked in my chart. What is a descending triangle? it forms at the highs or lows of a trend. Notice that the market is not making lower lows its making only lower highs and its forming a triangle pattern. This pattern is forming after a uptrend and the triangle can break either of the sides in my opinion it has a good chance of breaking up side as usually it gives a breakout as per the previous trend. Once the triangle breaks out there is immense energy released and the move is bigger thn the usual moves in the market. Usually this pattern gives a breakout at the apex of the triangle lets see how the market performs tomorrow and if it finds support at 2050 level again. TIll the time market is above 2050 i am bullish.
Hit like & follow to show your support.

Is it making a pattern ??Market is still waiting for direction, and its forming a triangle pattern and it can break either of the sides. Today again it was not a decisive day it made a green candle but its not very bullish. Market can still range for days to come and give a breakout at the apex of the triangle. I am still bullish on this one.
Hit like & follow to support.

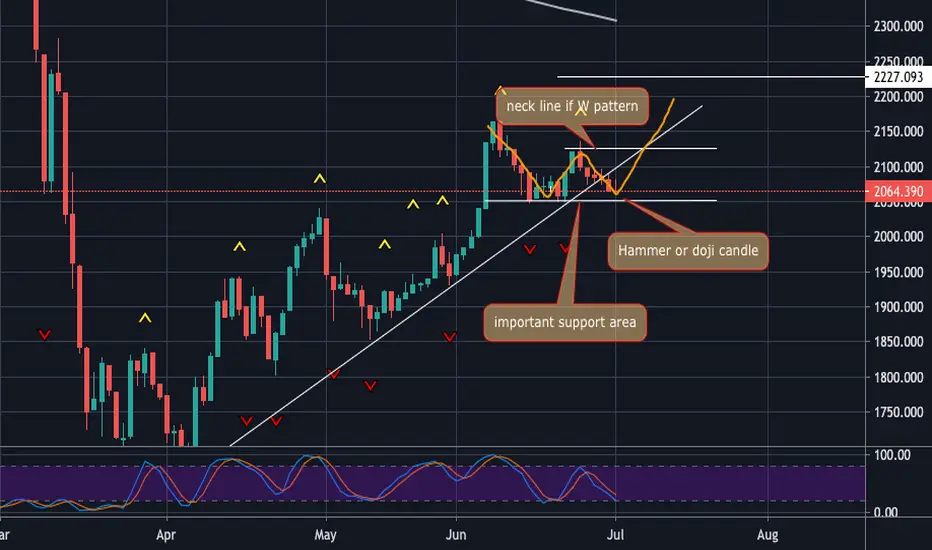
Dubai Financial Market - Weekend ReviewNot a very powerful week in terms on movement we only had 2 days of green candle and 3 days in red infact we closed in red too. Lets analyze, market took support at very important area of 2050 and bounced back and it made a high of 2100 it tried to break it but found resistance and it retraced back to 2072 and again it found support in this area which is marked in the chart and bounced from there made a closed at 2082 printing a hammer like doji candle indicating bull pressure and good support. Market is in side was as of now after breaking the upside trend line. The range as of now is 2050 to 2120 area.
Market should resume its upside coming week crossing 2100 level soon. Lets wait and stalk how does the market perform this coming week sure many opportunities spotted last week and we will get more opportunities coming week too. I am bullish till its above 2050 levels. Happy weekend
Hit like & follow if you like my analysis.

DFM bulls are tiredTodays session was just red red all over, it found support ar 2050 level and it took off from here but in todays session it made a red candle closing below yesterdays close there was heaving selling pressure and profit booking on pervious gains it means investors are booking profit early and are not confident. Profit booking normal and such small corrections after big moves are normal but we didnt have a very big move yet. It closed just at the near support level as marked in the chart, 2080 is support area now. So what next? i think market should resume upwards tomorrow or stay in this zone for another day before making a move upside. We stick with our scenario that trend line is broken and now the market is in the range that can potential make a W pattern. Tomorrow is last trading day of the week and i can expect more selling pressure as investor would not like to keep their positions open. As long as market is above 2050 i am bullish.
---Hit like & follow to show your support----

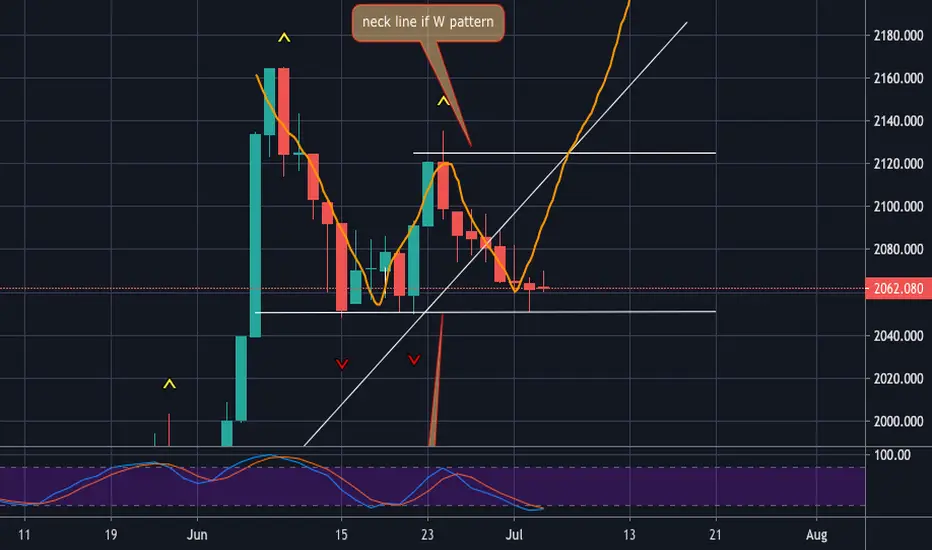
DFMMarket is gaining more momentum with more traders and volumes. It closed higher and it tried the psychological resistance number of 2100 but it could not close above it. My analysis say it will cross 2100 and should pass 2120 very soon activating the W patter which will result in new target and new highs. I am bullish in this market.
Hit like & Follow :)

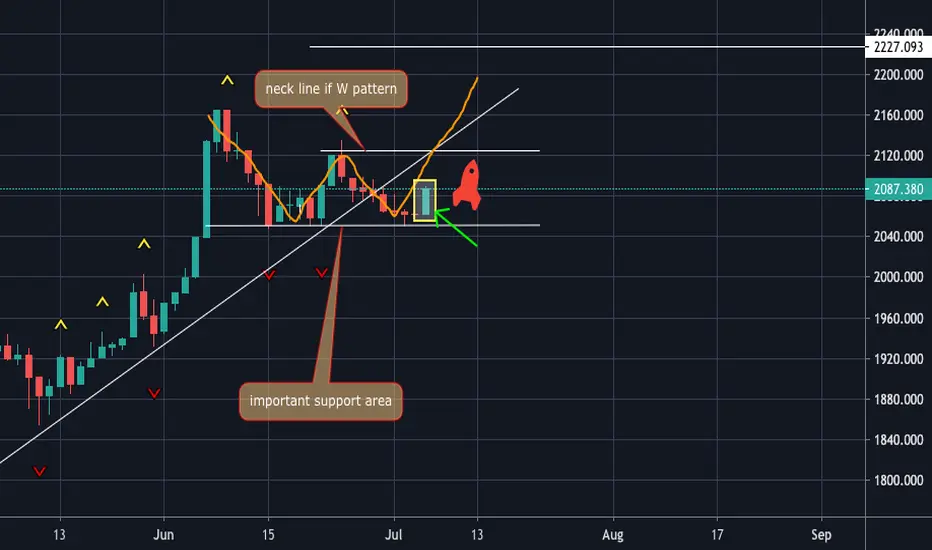
DFM Rocket Launch!!Yes market made a big move today finally and thankfully upside. After series of dojis it made a decisive candle today activating bulls and pushing market upside. My plan and market scenario is still the same market took support at 2050 and now moving up this kind of is a indication that retracement is done for now and it have made a double bottow or W pattern in progress it will confirm once it crosses 2120 and move more upside. Next target is 2120 it may go direct or zig zag but the potential from here is to go up. Bullish for sure. Time to make money, let be in the money!
Hit like & follow
DFM in RangeRed candle again for the 8th day again and on first day of the trading week. Market is caught in a range market opens positive but cannot maintain its strength and closes negative market is trading on a thin volume & not many trades are happening these days. Today it closed red and made a brearish doji candle, thursday it made bullish hammer candle taking support at 2051 area. So bulls and bears are fighting for a direction and one thing is for sure there will be a big move soon on either side once this range is broken more the consolidation more the bigger move. No doubt market is weaker and as of now sellers are trying to sell what ever they have there are no big buyers for now. Smart money is waiting for some catalyst to buy the stocks. I am still bullish till the time market is above 2050 area which is a very crucial support area. I think there will be more selling pressure tomorrow in the first half and market may recover later. Lets see how the market performs tomorrow.
Hit like & follow
Dubai Financial Market Bulls & Bears who wins??In my yesterdays idea i mentioned 2050 is crucial support area, today the market bounced from 2051 and could not break the support area. I was expecting market to make a doji or a hammer candle and as expected it made a nice hammer candle right at the support level. So is the support level confirmed? is the retracement done? bull trend started? The answer is BIG NO!! market just took a hold at the support area and made a hammer candle after a inverted hammer candle day before yesterday. Todays hammer is bullish but to confirm the support we need to see a green candle that should close above 2070 or above 2075 to be very safe. If the market makes upward move from here and confirms W patter we can expect market to make a new high very soon i had mentioned earlier the target could be 2225 area. I am still bullish as the market is above 2050 area. Next week could be very interesting lets stalk the market and find an edge to trade. More details next week, Happy Weekend!!
Hit like & follow :)

DFM heading south?Market is getting weaker day by day but interesting part is its not making any big moves to down its climbing slowly. As mentioned earlier 2050 is a crucial support area for this uptrend to sustain i would see a sign of relief it makes a hammer or a doji candle tomorrow to hold at this level. If it wants to break this important level it has to break it with a big decisive candle with a strong momentum. As per my analysis it should take a hold from tomorrow. If it has to make a W pattern at this level it has to hold 2050 area and cross 2120 to confirm the W pattern and resume the uptrend. Lets not forget trend line is broken already and market is just at the near support area. We have to wait for tomorrows closing which will be very important. I am bullish till the market is above 2050 level.
Hit like & follow :)