DOCK reflectas shown on chart
each time dock hit support trend line it give 30%
buy 270 sat to 280
stop loss below , lets say about 255 just in case of fake broken
goodluck
DOCKBTC trade ideas

DOCK-BTC Daily chart - Low risk high reward longs entryIt has held the august lows and therefore a strong contender for good upmove as its has shown a lot of strength in this carnage thus far..
Showing good amount of accumulation even in recent correction in november..
Currently at 340...can easily do 750 imo when wave C/3 unfolds

DOCK comebackDDOCK is going to breakthrough the descending trendline. That will bring it into the low resistance space where it can move freely towards nearest resistance zones at 365 – 375 – 390 and 400. Most probably, the last one will be the hardest to break.
Support at ~320 should hold but it may spike to 310 as well. Otherwise sell in loss.

Curriculum vitae of the digital age. Analytics DOCK / BTCBUY: 0,00000252 - 0,00000262
SELL: 0,00000388, 0,00000520
STOP-LOSS: 0,00000249
Support: 0,00000256
Resistance: 0,00000388
The dock.io team has created a decentralized data exchange protocol for the distribution and management of personal data in the professional industry. It aims to streamline the collection of data from existing networks that have no incentive or can not share information with competitors.
The dock.io goals are to create a workspace in which:
- a user profile will be integrated with it (work experience, education, location, contacts, qualifications, etc.) and filled with information from different platforms and
- stimulate transactions and information sharing, giving the user full control over their data.
Binance listing of the token took place at the end of July. From its moment until August 14, the price fell along with the market. Minimum was formed at the level of 0.00000190. After reaching this point, the asset price rose by 80% within 5 days, and by October 28 it showed a gain of 250% from the minimum price.
The chart shows a slow but steady upward trend. Analysis of trading volume suggests that the asset is supported by big investors.
The entry price into the asset is not higher than 0.00000252 - 0.00000262. Additional risks are given by an uncertain situation with Bitcoin and the markets in general. Therefore, be sure to put a stop-loss on the level of 0.00000249, slightly below the level of support. The first zone of closing long positions is within 0.00000388, the next is 0.00000520.
Intra-day volatility is 7-15%, which allows you to comfortably trade an asset within the day.
The token is suitable for both short-term trading and long-term investments.line. If the price breaks through it - will possible updating the minimum.
In our opinion, the current fall is an artificially provoked case, the assets behavior was deliberately led to last year’s model. It seems that the manipulators have left the market today and the price is formed solely on the basis of market expectations.


DOCK going up?S/R analysis based on two aspects: first the actual price is moving at same rithm but different speed (movement seems to be more consolidated this time) as circled area. Second is DOCK moving around its support line (bottom of uptrend channel).
If history repeats as marked on yellow, DOCK might move up towards TP1, then back to the rebound line and finally up again.

DOCK/BTC in the optimal BUY zoneWe're inside a 4H breaker currently, retesting it as support again, and also a nice fib retracement zone.
If we bounce from here that would also be a higher low and a good bullish sign for further expansion upwards.
If you look below you can see that we bounced from an important daily pivot level too.
---------
Colors I use for a more organized chart:
15 min - Cyan
1H - Gray
4H - Red
Daily - Green
Weekly - Orange
---------
Some terms I used:
-Bullish breaker - an orderblock (a green or red candle, in this case green) that preceeded a move that took out a previous swing low, but was later nuked through. If the price comes back to that block, it is expected to act as support.

DOCK within an ascending triangle pattern. DOCK/BTC appears to be within an ascending triangle pattern. So far, we've made 3 sets of higher lows with the peak of the ascending triangle around 430. There is an argument if you used wicks for the top of the ascending triangle that 440 (.5 fib level) would be the top. Either way, DOCK is looking pretty good if it can hold this pattern. I'm watching the .5 fib level around 440 and the .618 fib level around 490-500 as possible targets. RSI is in a rising channel as well. The MACD on the 4-hour does look like it might have a bearish cross-over, so watch the bottom of the ascending triangle around 400, as for we might see another retest of it again. I'm keeping an eye on the moving averages (10 MA in orange, 20 MA in light-blue, 50 MA in green, 100 MA in yellow, and 200 MA in red) and watching for any potential cross-overs should the price rebound from the bottom of the ascending triangle. If price breaks down, we have tight stops in place to minimize losses. R/R (Risk/Reward) is pretty good on this trade.
Entry: 398-408
Target 1: 428 (Possible top of the ascending triangle.)
Target 2: 440 (Also a possible top of the ascending triangle, and this is the .5 fib level.)
Target 3: 490 (.618 fib level.)
Stop-loss:
390-395 (Below the ascending triangle.)
370-375 (Below the 200 MA on the 4-hour and below the .382 fib level.)
--This is not financial advice. Always do your own research and come to your own conclusions before buying/investing, as investing in cryptocurrencies comes with high risk and high amounts of volatility.

Daily Bullish Signal $DOCK #DOCK DOCK/BTC (09 November)#DOCK (DOCK/BTC)
Stop : 375
BLUE ARROW indicates EXPECTED Time and Targets
Level up Stoploss point to maximize profit and reduce risk
Contact me if you need help

LONG DOCK/BTC in the optimal BUY zoneWe're inside a 4H breaker currently, retesting it as support again, and also a nice fib retracement zone.
If we bounce from here that would also be a higher low and a good bullish sign for further expansion upwards.
If you look below you can see that we bounced from an important daily pivot level too.
---------
Colors I use for a more organized chart:
15 min - Cyan
1H - Gray
4H - Red
Daily - Green
Weekly - Orange
---------
Some terms I used:
-Bullish breaker - an orderblock (a green or red candle, in this case green) that preceeded a move that took out a previous swing low, but was later nuked through. If the price comes back to that block, it is expected to act as support.
Original idea by Svarog

DOCK/BTC - Triple Three (Zigzag+Zigzag+Triangle)Everything on the chart !
Like and share it for more chart .
Good Luck guys !


DOCK/BTC is currently consolidating on the .5 fib level.DOCK/BTC has been consolidating nicely on the .5 fib level around 430-440. We can see DOCK/BTC has held the .5 fib level on numerous occasions following its huge run-up to 680 sat's. We have the 50 EMA on the 4-hour acting as support in conjunction with the .5 fib level, and we have the 100 EMA on the 4-hour just below the .5 fib level with the 200 EMA on the 4-hour right around the .382 fib level on my chart. We can also see the RSI has held fairly nicely on my light-blue support line over the past couple days. I think we have a lot of confluence around the .5 fib level which will be hard for sellers to break, and we have seen evidence of that with the numerous retests of the .5 fib level over the last couple days following that huge move to 680 sat's. I suspect the most likely scenario is a move up near the .618 fib level around 500, as we've seen this area act as strong resistance on a few occasions. If we break below the .5 fib level and below the 100 EMA on the 4-hour, there is a good chance we could retest the .382 fib level around 380.
Entry:
440-450 (slightly above the .5 fib level and on/slightly above the 50 EMA on the 4-hour)
Target 1: 494-500 (.618 fib level.)
Target 2: 570-580 (.786 fib level.)
Target 3: 675-685 (1 fib level.)
Stop-loss:
400-410 (below the .5 fib level and below the 50/100 EMA's on the 4-hour chart.)
--This is not financial advice. Always do your own research and come to your own conclusions before buying/investing, as investing in cryptocurrencies comes with high risk and high amounts of volatility.

DOCK/BTC - Long- Consistent uptrend, cup/curve --> two potential trends, both bullish
- Strong volume upticks

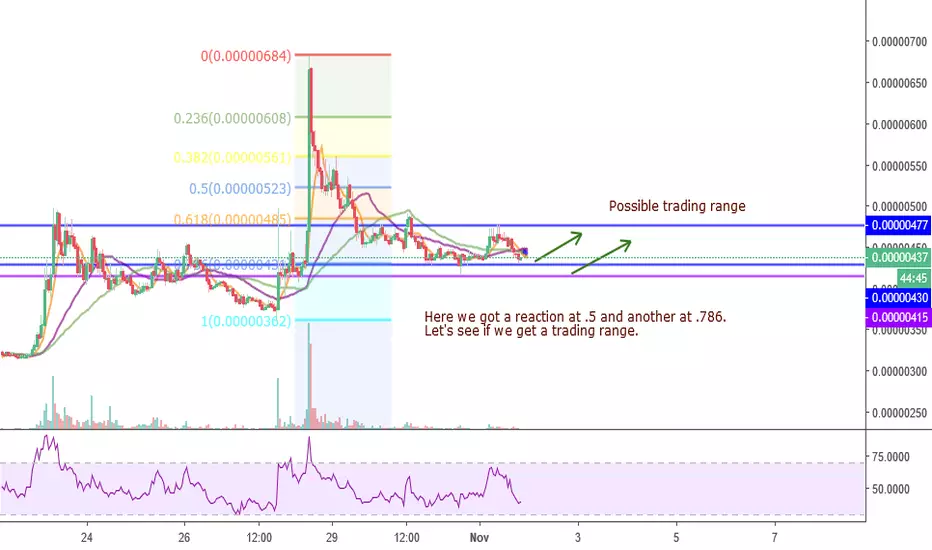
DOCK-BTC can we get another bounce at .786?Putting out my analysis. Mostly because it's easy for me to review them in future this way. I do this shit because I love it. If you don't appreciate noone is forcing you to read it.
(Not hating on .618 even though it might seem like I am.) :-)
Thanks for reading. Have a ___ day.


DOCK don't need roads where it is going* Marty! You've gotta come back with me!
* Where?
* Back to the future.
This coin is asking for a pump. It almost crossed all major resistance zones and ready to get into free space. Almost free space as last trading activity in upper zones happened in July so it is ages for crypto world. I doubt any major bags are still on hold. So what happens with price, when it has no resistance above? It fly to the moon just like PHX did yesterday making over 340% profit in a matter of hours for those who hodled. I doubt there were any holders with such iron balls but still possibility was beautiful.
I don’t know if DOCK will do the same but it is capable of doing 100% at least. I'm painting my balls in iron colors and will be holding ))))

$DOCK retrace, whats next?So Dock seemed to have retracement way deeper than expected. But non the less we did loose volume as well.
My initial thoughts on this was people are rather going back to BTC as CME futures are expiring today, so rather be safe than have BTC dump your favourite alts on you ;)
SO back to DOCK! On ALL the lower time frames we see that its very oversold right now, currently I see we are in a falling wedge (bullish pattern) I do however expect us to hold this bot and see our original upside targets continuing!
Good luck and trade safe out there guys!

DOCK volume shows accumulation and bull side biasSome takaways on DOCK token:
- DOCK price is way below its ICO price
- Automated bot trading intenstively on DOCK due to its low satoshi value
- Volume zone lean toward bull case (see the Volume zone indicator chart analysis above)
- Weekly volume traded on Binance is far beyond their supply coins, so basically, it's about time to move either up or down aggressively
Volume tells me to buy so I bought at around 250 - 300sts zone with small size
Fundamental:
- They created social network for the professionals which competing directly to LinkedIn
- The team with strong background and profound experience as they also built remote.com which is quite succesfull.
Target: 2x - 4x depending on the whole market. Cheers.

DOCK could be set to move higher following consolidation.DOCK/BTC could be set to move higher should this consolidation area hold. We can see DOCK is currently holding the .618 fib level, and we could see it make a run to the 1.272 fib level around 576, if not higher to the 1.414 fib level around 617 if our consolidation into a large move up plays out. We've seen other coins (such as GO and RVN) have a large move up, then following that large move up, they consolidate for awhile, and then have another large move up after consolidating. There is a possibility DOCK could do the same (in regards to consolidating after a big move up, then moving higher after consolidation) in my opinion.
Entry: 388-400 (.618 fib level around 388 should act as a good entry.)
Target 1: 436 (.786 fib level)
Target 2: 498 (Peak of the previous move up and will act as the 1 fib level on our chart.)
Target 3: 576 (1.272 fib level.)
Target 4: 617 (1.414 fib level.)
SL: 370-377 depending on risk.
--This is not financial advice. Always do your own research and come to your own conclusions before buying/investing, as investing in cryptocurrencies comes with high risk and high amounts of volatility.


$DOCK looking extremely good here!Im am quite liking the $DOCK graph right here! Can cleary see an ending C wave diagonal which already started to break out!
Target for a 1:1.6 measured move should be around 676 sats! Taking this call myself!
Good luck to all who decides to join me on this journey!
