Dow Inc. retest 1st and now breaking out Ranged from July 2025 and broke out on 9th Jan 2026. Then retested on Jan 29 and now is breaking out properly with volume too.
This is not a solicitation to take any type of trade or a recommendation to hold. Please speak to your financial advisor 1st.
Key facts today
Next report date
—
Report period
—
EPS estimate
—
Revenue estimate
—
−3.69 USD
−2.63 B USD
39.97 B USD
707.82 M
About Dow Inc.
Sector
Industry
CEO
James R. Fitterling
Website
Headquarters
Midland
Founded
1897
IPO date
Mar 20, 2019
Identifiers
3
ISIN US2605571031
Dow, Inc. is a materials science company, which engages in the development of innovative solutions. It operates through the following segments: Packaging and Specialty Plastics, Industrial Intermediates and Infrastructure, and Performance Materials and Coatings. The Packaging and Specialty Plastics segment consists of hydrocarbons and energy and packaging and specialty plastics. The Industrial Intermediates and Infrastructure segment covers the industrial solutions and polyurethanes and construction chemicals. The Performance Materials and Coatings segment includes coatings and performance monomers and consumer solutions. The company was founded in 1897 and is headquartered in Midland, MI.
Related stocks

DOW April17 30CDOW is showing strong price reaction as it reclaims and consolidates on the 200dma. Calls for April17 are available for 1.50 - trade gets stopped out if price goes below 25.70

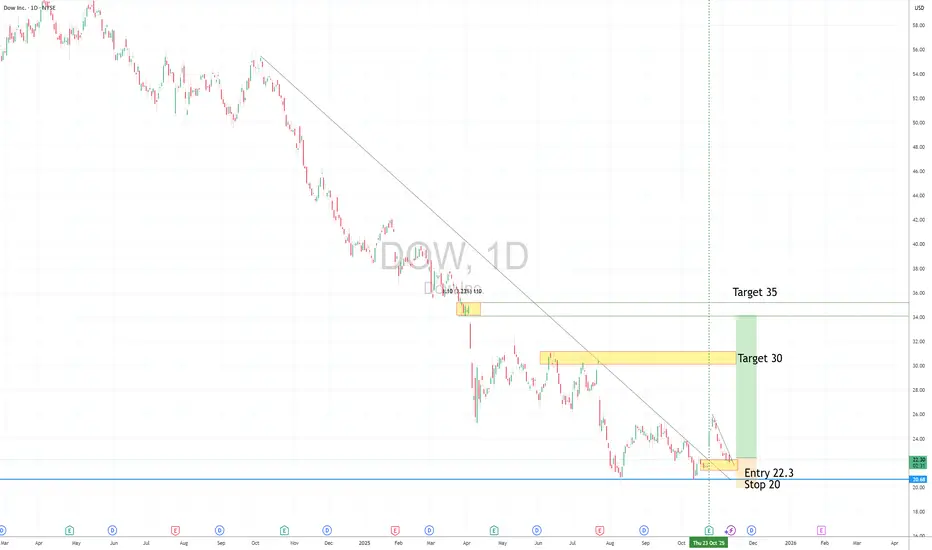
DOW longdemand Zone, Trendline break + retest
Long entry 22.3
Stop 20,
Target 30, 35
Risk management is much more important than a good entry point.
I am not a PRO trader.
In my trading plan, the Max Risk of each short term trade should be less than 1% of an account.
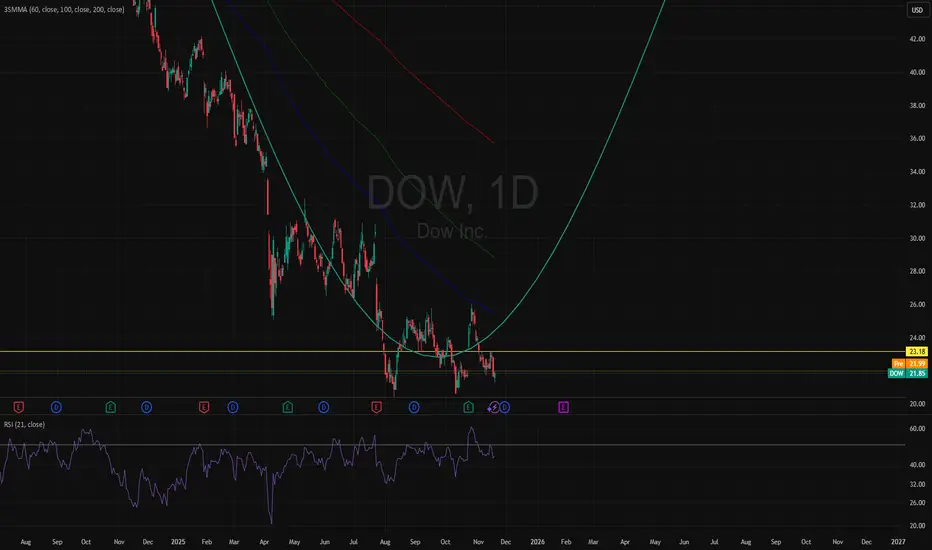
The BUY Signal looks stong with this one.NYSE:DOW
Using Sinewave Analysis, 3SMA, and RSI
I have noticed at the bottom of a 5 year low, a divergence as well higher high and lower low in attempts to break the SMA.
levels to manage DOW positions into the $30 zoneThe "Bad News is Good News" Beat: The company reported a loss of $0.19 per share, which was significantly better than the consensus estimate of a $0.31 loss.
The Actual Bad News: Revenue missed expectations, coming in at $9.97 billion versus a forecast of ~$10.04-$10.22 billion.
The Reaction: The

DOW! DOW! DOW!IDK.
Tariff is as tariff does....
makes lot of work to do with all this damn goVErnMENt $$$$$.
No really what is with all those cans of chew.
Why is it so hard to get pump gas E85 in AZ PFFFFFFF
Moonshine delivers thaaa best can of grain I know.
SOme guy dropped out a airplane in this dudes

Option Alert: $DOW OCT 31 2025 $21 Calls – 97% ROI Potential in Enter: NYSE:DOW OCT 31 2025 $21 CALLS
Buy in Price: $1.37 - $1.41
Take Profit: $2.78
Stop Bleeding: $1.24
ROI Potential: 97%
Exit Within: 76 Minutes
DOW BUY SIGNAL Trade at Own RIsk! Exclaimer
seems as though the DOW is following a well put FIB retracement as well as Elliot Wave

The DOW, Gold, and Morgan StanleyAs it turns out, the stock market that appears to be the gift that keeps giving, is actually giving nothing. In reality, when we measure the value of the DOW with real money (Gold) rather than fiat inflationary currency, the markets are crashing down so fast it'll make your head spin. The $NYSE:DOW/

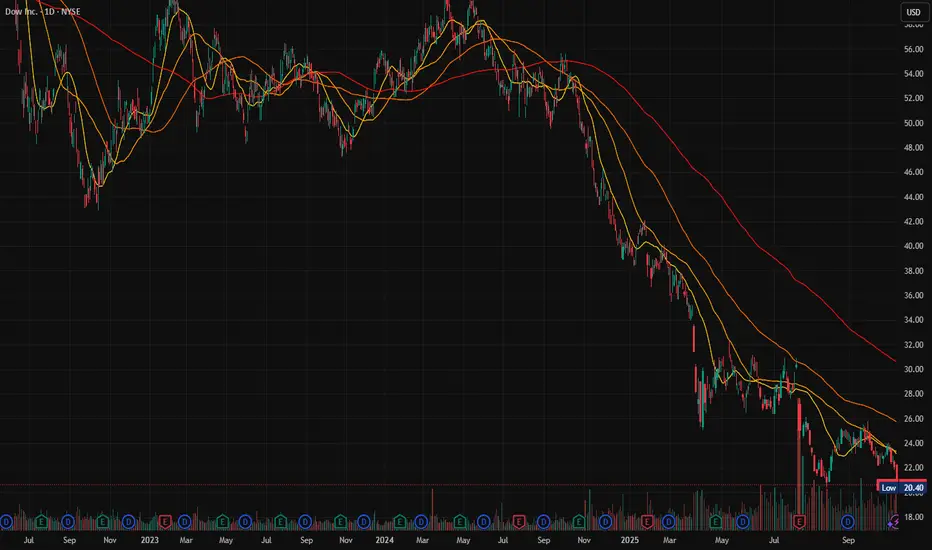
DOW — possible Inverse Head & Shoulders baseDOW remains in a well-defined downward channel with the long 50EMA still sloping lower. Within that trend, price rebounded off the channel floor and is building a potential Inverse Head & Shoulders that could trigger a trend-counter rally inside the channel (not a confirmed long-term reversal yet).

See all ideas
Summarizing what the indicators are suggesting.
Neutral
SellBuy
Strong sellStrong buy
Strong sellSellNeutralBuyStrong buy
Neutral
SellBuy
Strong sellStrong buy
Strong sellSellNeutralBuyStrong buy
Neutral
SellBuy
Strong sellStrong buy
Strong sellSellNeutralBuyStrong buy
An aggregate view of professional's ratings.
Neutral
SellBuy
Strong sellStrong buy
Strong sellSellNeutralBuyStrong buy
Neutral
SellBuy
Strong sellStrong buy
Strong sellSellNeutralBuyStrong buy
Neutral
SellBuy
Strong sellStrong buy
Strong sellSellNeutralBuyStrong buy
Displays a symbol's price movements over previous years to identify recurring trends.
DOW.HG
Union Carbide Corporation 7.75% 01-OCT-2096Yield to maturity
6.91%
Maturity date
Oct 1, 2096
DOW5499244
Dow Chemical Company 6.7% 15-NOV-2052Yield to maturity
6.77%
Maturity date
Nov 15, 2052
DOW5502198
Dow Chemical Company 6.75% 15-NOV-2052Yield to maturity
6.75%
Maturity date
Nov 15, 2052
DOW5680211
Dow Chemical Company 6.7% 15-NOV-2053Yield to maturity
6.70%
Maturity date
Nov 15, 2053
DOW6079044
Dow Chemical Company 6.55% 15-MAY-2055Yield to maturity
6.66%
Maturity date
May 15, 2055
DOW6073294
Dow Chemical Company 6.5% 15-MAY-2055Yield to maturity
6.57%
Maturity date
May 15, 2055
DOW6015753
Dow Chemical Company 5.95% 15-MAR-2055Yield to maturity
6.55%
Maturity date
Mar 15, 2055
DOW6238716
Dow Chemical Company 6.45% 15-NOV-2055Yield to maturity
6.54%
Maturity date
Nov 15, 2055
DOW5494029
Dow Chemical Company 6.9% 15-MAY-2053Yield to maturity
6.54%
Maturity date
May 15, 2053
DOW6067944
Dow Chemical Company 6.55% 15-MAY-2055Yield to maturity
6.54%
Maturity date
May 15, 2055
DOW5750371
Dow Chemical Company 5.6% 15-FEB-2054Yield to maturity
6.54%
Maturity date
Feb 15, 2054
See all DOW bonds
Frequently Asked Questions
The current price of DOW is 32.82 USD — it has increased by 5.57% in the past 24 hours. Watch Dow Inc. stock price performance more closely on the chart.
Depending on the exchange, the stock ticker may vary. For instance, on NYSE exchange Dow Inc. stocks are traded under the ticker DOW.
DOW stock has risen by 8.08% compared to the previous week, the month change is a 29.47% rise, over the last year Dow Inc. has showed a −12.67% decrease.
We've gathered analysts' opinions on Dow Inc. future price: according to them, DOW price has a max estimate of 32.00 USD and a min estimate of 22.00 USD. Watch DOW chart and read a more detailed Dow Inc. stock forecast: see what analysts think of Dow Inc. and suggest that you do with its stocks.
DOW stock is 7.63% volatile and has beta coefficient of 1.39. Track Dow Inc. stock price on the chart and check out the list of the most volatile stocks — is Dow Inc. there?
Today Dow Inc. has the market capitalization of 21.67 B, it has decreased by −3.86% over the last week.
Yes, you can track Dow Inc. financials in yearly and quarterly reports right on TradingView.
Dow Inc. is going to release the next earnings report on Apr 23, 2026. Keep track of upcoming events with our Earnings Calendar.
DOW earnings for the last quarter are −0.34 USD per share, whereas the estimation was −0.46 USD resulting in a 26.66% surprise. The estimated earnings for the next quarter are −0.34 USD per share. See more details about Dow Inc. earnings.
Dow Inc. revenue for the last quarter amounts to 9.46 B USD, despite the estimated figure of 9.46 B USD. In the next quarter, revenue is expected to reach 9.46 B USD.
DOW net income for the last quarter is −1.54 B USD, while the quarter before that showed 60.00 M USD of net income which accounts for −2.67 K% change. Track more Dow Inc. financial stats to get the full picture.
Yes, DOW dividends are paid quarterly. The last dividend per share was 0.35 USD. As of today, Dividend Yield (TTM)% is 6.89%. Tracking Dow Inc. dividends might help you take more informed decisions.
As of Feb 4, 2026, the company has 34.6 K employees. See our rating of the largest employees — is Dow Inc. on this list?
EBITDA measures a company's operating performance, its growth signifies an improvement in the efficiency of a company. Dow Inc. EBITDA is 3.16 B USD, and current EBITDA margin is 7.87%. See more stats in Dow Inc. financial statements.
Like other stocks, DOW shares are traded on stock exchanges, e.g. Nasdaq, Nyse, Euronext, and the easiest way to buy them is through an online stock broker. To do this, you need to open an account and follow a broker's procedures, then start trading. You can trade Dow Inc. stock right from TradingView charts — choose your broker and connect to your account.
Investing in stocks requires a comprehensive research: you should carefully study all the available data, e.g. company's financials, related news, and its technical analysis. So Dow Inc. technincal analysis shows the strong buy rating today, and its 1 week rating is buy. Since market conditions are prone to changes, it's worth looking a bit further into the future — according to the 1 month rating Dow Inc. stock shows the neutral signal. See more of Dow Inc. technicals for a more comprehensive analysis.
If you're still not sure, try looking for inspiration in our curated watchlists.
If you're still not sure, try looking for inspiration in our curated watchlists.