NAQ trade ideas

Price discovery ahead for Nasdaq?This idea was put together for a non-trader friend almost two weeks ago and I didn't expect any new highs to be reached just yet but it looks like she might break up here anyway (flagging this as a long but I wouldn't actually enter till support is confirmed on the prior high if I were you so beware)

Possible Move down before an UpNasdaq is going to probably make a move down retesting the recent lows and then it could move up. This current 60 min up move may not be the breakout yet and I think we are still in a complex correction. I expect a move down in the 60 and then a move up to go beyond the recent 240 highs.

NDAQ time to sell the bears can lead the price to touch supportThe price action is near at the pennant's resistance but this time the bulls got weak even before touching the pennant's resistance.
There is also a bearish shark formed and it is likely to be completed now and the price action is in the potential reversal zone of this pattern.
The 25MA is bearish and moving down to give a death cross with 50MA. We also have pivot point at the support of pennant and I am expecting that the price action will touch this pivot and move up insha Allah.
The re-buy can be 0.50 to 0.786 fibonacci of C to D leg of shark pattern. But the buying depends when the price action will touch or drop near pennant's support and what signals the other indicators and oscillators will give us at that time whether more bearish or bullish. Insha Allah I will give update on it.
Regards,
Atif Akbar (moon333)

Upward trend, Do not let them tell you something else#NasdaqWe have a rising trend, Stochastic in the correct range to open a positivity on the NASDAQ, Ichimoku indicator supports further long-term gains, and if we finish a green week it is a positive sign after the star-candle


NASDAQMy bias with the NASDAQ is similar to the S&P, with all time highs played as resistance; the market may sell off. This could be the turning point for a Bear's market, or a minor pull back for new ATH's.

THE TARIFF MAN COMETH
He'll huff and he'll puff and he'll .....Well that's about it .
At the moment they are tallying up the newly acquired shorts on the markets to add to the get rich quick black Monday desperados .By Friday they should have enough shorts to have a great shindig in the Hamptons at the weekend .As soon as it's official and they know they made a killing The Donald will shake hands with a Chinaman and Fri/Mon the markets will fly hitting the doom brigade where it hurts as the bull run commences.
AUD/USD will go on one of those unjustified annoying bull runs full of bluster and hype as it grasps onto the China proxy as that's all it's got beneath it's wings ....Of course it will come banging back down but buy hype and sell fact .


NDAQ the market indice that is still strongof all the NYSE , DJI and NDAQ
NDAQ is the only indice that remain strong
i think that it will have today or tomorrow are last day or two that this pair will be bullish
after that I will put this NDAQ in selling mode
If you like my signal please help to like and follow
Thank you

NASDAQ final push to the upsideNASDAQ Analysis. Liquidity on the upside has to be taken out before a hard dump in the market. Do not wait for news, rather wait for financial institutions to provide you the right signals so that you can analyze their moves and move with them rather than acting than a retail trader.
SHORT TERM BEARISH , LONG TERM BULLISHLook to short it once it has broken below the red rectangle at 82 TP at 80 , then look for long term buying opportunities at around 80 targeting 92

NASDAQ INC: WEEKLY OUTLOOK!Hey tradomaniacs,
welcome to the weekly outlook!
I think the charts says enough!
Will the Double-Top get triggered?
The current situation says "NO" to Double-TOP but it looks like the current cycle is going to be bearish down to the previous "Supply-Zone."
The market just bounced off the 50 and 100 MA and seems to continue the rally downwards to complete WAVE 2.
After that we should see another attempt upwards cklose the the marked up target-zone of TEAM BEAR!
Great chance should come very soon!
---------------------------------------------------------------------------------------------------------------------------------
LEAVE A LIKE AND A COMMENT - I appreciate every support! =)
Peace and good trades
Irasor
Wanna see more? Don`t forget to follow me.
Any questions? PM me. :-)

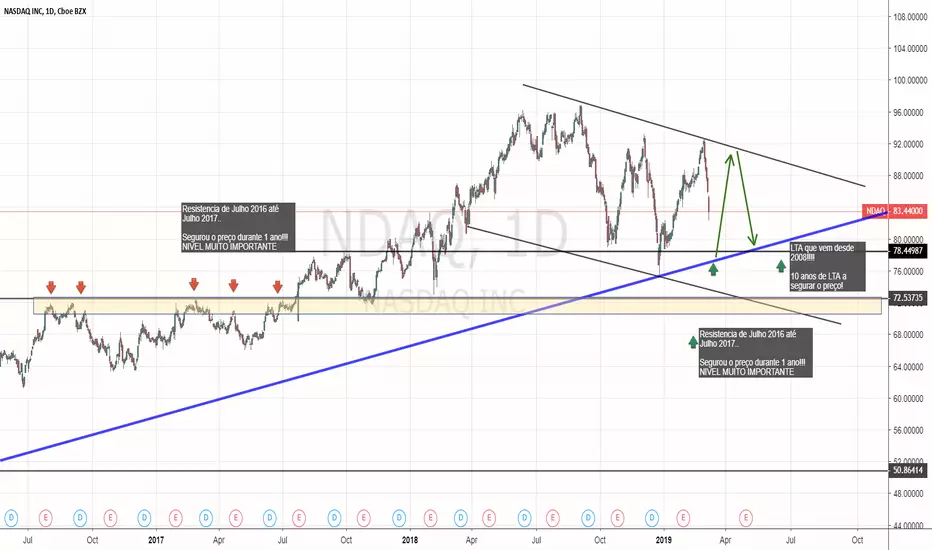
NASDAQ - LTA de 2008 Segura para dar novo topo ou cai para 2007?NASDAQ - LTA de 2008 Segura para dar novo topo ou cai para 2007?
Niveis importantes a serem testados:
- LTA que vem desde 2008 (Azul)
- Resistencia que segurou o preço durante 1ano (Amarelo)
-------------------------------
Dependendo das noticias que surgirem nos proximos relatorios o preço é segurado pela LTA ou caso sejam resultados pessimistas pode mesmo vir a cair para os preços de 2007 (amarelo).
Se cair para 2007 - Esperar sinal positivo de reversão, mais uma ou duas velas de forte confirmacao e é Long all in! :D
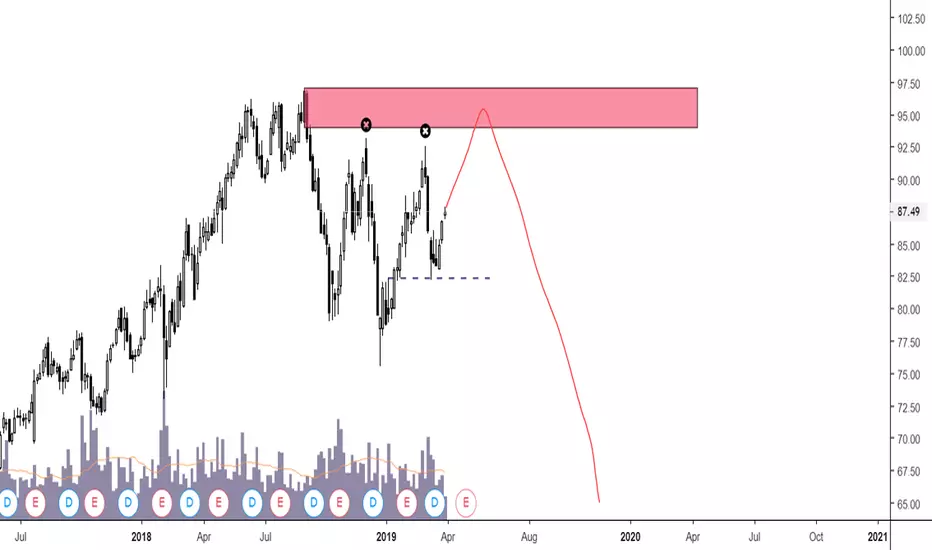
NDAQ: 2019 RECESSIONI have been charting Nasdaq for some time now and based on recent movements in price, I am finally confident enough to post my prediction calling for a recession this year in 2019. The correction we saw in September to December of 2018 was our Wave A, of a three wave ABC correction. In the past few months we have been in the Wave B which often confuses many people into thinking bullish , and that the market has finished the correction and is going up to new highs. Sadly this is not the case, as can be seen with recent corrections in the past 3 days which happened right after hitting my price targets for Wave B, which confirms that we still do indeed have a Wave C down.
NDAQ hitting target for Wave B, immediately begins Wave C down:
I've also noticed a trend in our last recession in 2008 where the RSI hit 60 support levels at the top of the B Wave, before going back down to Wave C. I then decided to compare RSI in 2008, and RSI currently on weekly candles and we ended up being at the 60 resistance level as well, and at the top of Wave B, which also helps support my hypothesis of a Wave C down. In the following charts, take a look at the B Wave labeled in the RSI and how It matches with the B wave in the chart, also notice the 60 resistance level in RSI . Please also note that the Wave A in both charts and RSI at both timeframes will look different as the Wave A in 2007-2008 was made up of 5 sub waves, and the one that happened in 2018 was made up of 3 sub waves.
NDAQ 2007-2008, RSI and correction:
NDAQ 2018-2019, RSI and correction:
As any trader should, I have also looked at the bigger picture overall for NDAQ to reinforce my prediction. We are currently in a Wave 4 for NDAQ overall, where as the 2008 financial crisis was the 1st Wave.
NDAQ the bigger picture:
Disclaimer: This is my prediction and I am posting for educational purposes only.

NASDAQ Trading Opportunity from Weekly Chart!!As you can see on the chart, NASDAQ is currently in a weekly down trend and approaching the most recent lower high.
This is not a detailed analysis and is not hard to execute, rather, just a good risk:reward shorting opportunity in which the trend is my friend.
Please note, if this downtrend is broken, which is hard to anticipate at the moment, then there will be plenty of opportnities to go long and make that loss back.
I am the Unemotional, Devotional Trader society doesn't deserve, but needs!

How to surf NASDAQ like a Boss. +62% in 175 days strategy.Hello everyone,
I just wanted to share one of my strategies since some of our clients have asked for it.
This is a strategy that I use for trading more significant accounts. But I've found out that it works really well even with small ones, especially if you use leverage.
On this strategy, we use Spectro M2 indicator by Hypester.org and Alpha-Omega Index , also by them.
The features we are seeing and have to be considered, I don't wanna get technical with names, so I'll keep this educational:
#1 The pivotal lines and it's green/red zones.
#2 The arrows that point an oversold/overbought area
#3 The warnings that give that extra confirmation
#4 The blue backgrounds that tell you that the current trend is exhausted
Now observe how I use it on the chart.
All the stop-losses, entries, take-profits & targets are there.
This strategy has yielded +62% in the last 175 days, and its conditions are relatively easy for anyone to follow.
I use this strategy for many other assets and timeframe - I shared it because I feel like it's one of the simplest and yet robust ones I use.
From that, you can guess what the next trade is, right? Let me know what you think below.
Good luck with your trading,
Specter

NASDAQ - Lets wait for price to break trend line
- WAIT, for pull back for confirmation to Execute
-

NDAQ- fractalized sketch of SPX
- one pure clear daily doji
- power reached previous tops
... it should go down..........
NASDAQNasdaq, how do I think? Here there is no definitive collapse in this market without first drawing a significant M or double maximum .... THIS THINK AND THIS BELIEVE HAPPENS ... ONCE THAT WE WILL HAVE THIS. WE WILL CONCENTRATE ON THE CPRIPTOVALUTE
