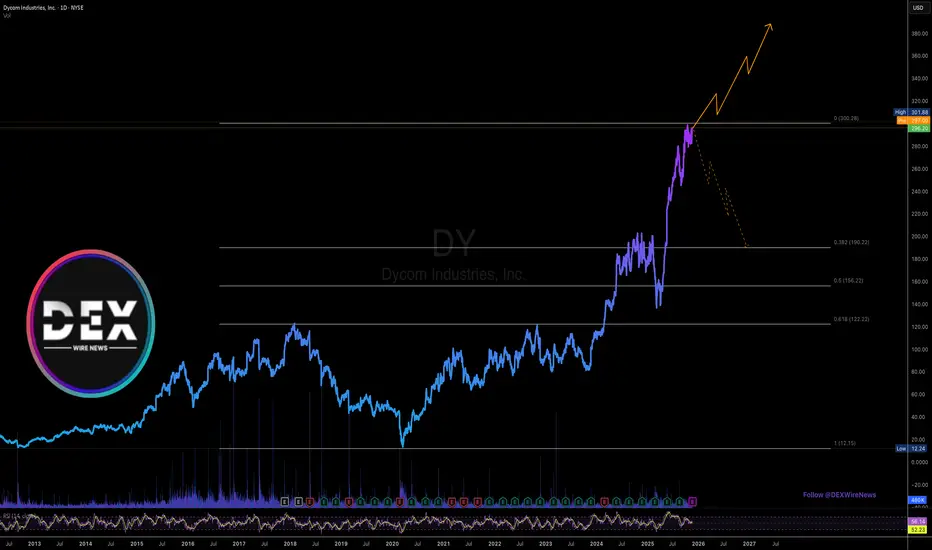
Dycom Industries, Inc. (DY) Set to Report Q4 Results TodayDycom Industries, Inc. (NYSE; NYSE:DY ) is set to reports its Q4 earnings results today before market open. the stock has close yesterdays session up 2.4% in extended trading.
With the RSI at 56, a favourable update could send the stock to the $350 resistant point. However, failure to release a p
Next report date
—
Report period
—
EPS estimate
—
Revenue estimate
—
10.28 USD
233.41 M USD
4.70 B USD
28.57 M
About Dycom Industries, Inc.
Sector
Industry
CEO
Daniel S. Peyovich
Website
Headquarters
West Palm Beach
Founded
1969
IPO date
Sep 24, 1990
Identifiers
3
ISIN US2674751019
Dycom Industries, Inc. provides contracting services throughout the United States. Its services include engineering, construction, maintenance and installation services to telecommunications providers, underground facility locating services to various utilities, including other construction and maintenance services to electric and gas utilities, and others. The company was founded in 1969 and is headquartered in West Palm Beach, FL.
Related stocks
Trade Alert: $DY NOV 21 2025 $300 CALLS – Target 48% ROI in 2 Enter: NYSE:DY NOV 21 2025 $300 CALLS
Buy in Price: $17.90 - $18.10
Take Profit: $26.79
Stop Bleeding: $15.93
ROI Potential: 48%
Exit Within: 2 Weeks

The price is below the upper Bollinger BandBollinger Bands :
Middle Line (SMA): The price is slightly above the middle line, which indicates that the stock is maintaining a neutral or mildly bullish stance, with potential support around this level.
Candlestick Pattern :
Price Action: After a recent pullback, the stock appears to b

Big Buyers come in on Hammer Candle for Bullish ContinuationDY coming in strong on Fridays close! Good buying opportunity and signal for next week.

DY | Good Time to Enter | BounceDycom Industries, Inc. provides specialty contracting services in the United States. The company offers program management and engineering services; plans and designs aerial, underground, and buried fiber optic, copper, and coaxial cable systems; and construction, maintenance, and installation servi

DY +20%There are impulse movement and horizontal consolidation (flag). Now the stock are going higher after the breakout. Be careful with the earing's date (31 aug).

DY - LONG - Bought into Dycom industries this morning on strength.
Note the RR - the stop is very very tight on this - because given current market conditions - there is every chance this is another bear market rally that will last a few days and then we plunge again!
The logic is simple - the stock was in an

$DY Setting up in a large BasePotential cheat entry on $DY of the 50 MA in a very large base (zoom out) that goes back to March 2021.

DY - Possible Short IdeaHello there,
It's been a while since I posted any ideas. I'm looking for this trade as a short, I'm counting on the double top to push the price into the support line.
OUR SL will be breaking the previous top ( around 106$ )
Please DYOR and this is not FA.
Thank you.

Dycom Announces Authorization of a New $150 Million Stock RepurcDY: Dycom Industries Inc
2022-03-02 06:03:00
Dycom Announces Authorization of a New $150 Million Stock Repurchase Program

See all ideas
Summarizing what the indicators are suggesting.
Neutral
SellBuy
Strong sellStrong buy
Strong sellSellNeutralBuyStrong buy
Neutral
SellBuy
Strong sellStrong buy
Strong sellSellNeutralBuyStrong buy
Neutral
SellBuy
Strong sellStrong buy
Strong sellSellNeutralBuyStrong buy
An aggregate view of professional's ratings.
Neutral
SellBuy
Strong sellStrong buy
Strong sellSellNeutralBuyStrong buy
Neutral
SellBuy
Strong sellStrong buy
Strong sellSellNeutralBuyStrong buy
Neutral
SellBuy
Strong sellStrong buy
Strong sellSellNeutralBuyStrong buy
Displays a symbol's price movements over previous years to identify recurring trends.
Frequently Asked Questions
The current price of DY is 381.23 USD — it has decreased by −0.61% in the past 24 hours. Watch Dycom Industries, Inc. stock price performance more closely on the chart.
Depending on the exchange, the stock ticker may vary. For instance, on NYSE exchange Dycom Industries, Inc. stocks are traded under the ticker DY.
DY stock has risen by 1.59% compared to the previous week, the month change is a 12.01% rise, over the last year Dycom Industries, Inc. has showed a 107.60% increase.
We've gathered analysts' opinions on Dycom Industries, Inc. future price: according to them, DY price has a max estimate of 510.00 USD and a min estimate of 360.00 USD. Watch DY chart and read a more detailed Dycom Industries, Inc. stock forecast: see what analysts think of Dycom Industries, Inc. and suggest that you do with its stocks.
DY stock is 6.10% volatile and has beta coefficient of 0.89. Track Dycom Industries, Inc. stock price on the chart and check out the list of the most volatile stocks — is Dycom Industries, Inc. there?
Today Dycom Industries, Inc. has the market capitalization of 11.11 B, it has decreased by −0.74% over the last week.
Yes, you can track Dycom Industries, Inc. financials in yearly and quarterly reports right on TradingView.
Dycom Industries, Inc. is going to release the next earnings report on Mar 4, 2026. Keep track of upcoming events with our Earnings Calendar.
DY earnings for the last quarter are 3.63 USD per share, whereas the estimation was 3.21 USD resulting in a 13.13% surprise. The estimated earnings for the next quarter are 1.78 USD per share. See more details about Dycom Industries, Inc. earnings.
Dycom Industries, Inc. revenue for the last quarter amounts to 1.34 B USD, despite the estimated figure of 1.41 B USD. In the next quarter, revenue is expected to reach 1.33 B USD.
DY net income for the last quarter is 106.36 M USD, while the quarter before that showed 97.48 M USD of net income which accounts for 9.11% change. Track more Dycom Industries, Inc. financial stats to get the full picture.
No, DY doesn't pay any dividends to its shareholders. But don't worry, we've prepared a list of high-dividend stocks for you.
As of Feb 3, 2026, the company has 15.62 K employees. See our rating of the largest employees — is Dycom Industries, Inc. on this list?
EBITDA measures a company's operating performance, its growth signifies an improvement in the efficiency of a company. Dycom Industries, Inc. EBITDA is 665.84 M USD, and current EBITDA margin is 11.47%. See more stats in Dycom Industries, Inc. financial statements.
Like other stocks, DY shares are traded on stock exchanges, e.g. Nasdaq, Nyse, Euronext, and the easiest way to buy them is through an online stock broker. To do this, you need to open an account and follow a broker's procedures, then start trading. You can trade Dycom Industries, Inc. stock right from TradingView charts — choose your broker and connect to your account.
Investing in stocks requires a comprehensive research: you should carefully study all the available data, e.g. company's financials, related news, and its technical analysis. So Dycom Industries, Inc. technincal analysis shows the strong buy rating today, and its 1 week rating is strong buy. Since market conditions are prone to changes, it's worth looking a bit further into the future — according to the 1 month rating Dycom Industries, Inc. stock shows the buy signal. See more of Dycom Industries, Inc. technicals for a more comprehensive analysis.
If you're still not sure, try looking for inspiration in our curated watchlists.
If you're still not sure, try looking for inspiration in our curated watchlists.