Inflation has Peaked-Multi-decade resistance trendline unbroken
-Bearish divergence on the Wolfpack
-"Overbought" on the RSI
-Curling price action
Trade ideas

CPI forecastThe CPI represents changes in prices of all goods and services purchased for consumption by urban households. User fees (such as water and sewer service) and sales and excise taxes paid by the consumer are also included. Income taxes and investment items (like stocks, bonds, and life insurance) are not included. Prices for the goods and services used to calculate the CPI are collected in 75 urban areas throughout the country and from about 23,000 retail and service establishments. Data on rents are collected from about 50,000 landlords or tenants.
The weight for an item is derived from reported expenditures on that item as estimated by the Consumer Expenditure Survey.
The stochastic indicator is pointing to an increase in inflation over the next few months. However, that doesn't necessarily predict an immediate increase in inflation this month.

How Inflation Works and Why Traders Must Understand ItInflation has become one of the most important topics in modern economics because of its recent prominence, affecting forex pairs, commodities, as well as everyday goods and services. In this post, our team will provide educational clarity on inflation, what it means, and the important definitions to understand whether you're new to markets or a savvy pro who needs a quick refresher on the topic.
Before we get to the exact calculation of inflation, let us first go over the terms you need to know. By understanding the exact terms surrounding inflation, you’ll have a solid foundation to think critically about the topic.
5 Inflation Terms to Know
1. Inflation occurs when prices rise over time. Think of it like blowing up a balloon – prices get bigger when inflation expands. While it might seem bad, a low and stable inflation rate is good for the economy. Central banks, like the Fed or the Bank of England, aim to keep inflation around 2% to keep stability.
2. Hyperinflation happens when inflation gets out of control, causing prices to skyrocket and currency to become devalued. Examples include Germany before the Second World War and Zimbabwe in the 2000s. Central banks work hard to prevent it.
3. Deflation is the opposite – prices fall. While it sounds good, it can lead to job losses and economic decline, creating a deflation spiral. Central banks may lower interest rates to counteract this.
4. Reflation and disinflation describe changes in the inflation rate. Reflation occurs when inflation rises, and disinflation happens when it falls. Japan faced disinflation in the 1990s, leading to economic stagnation.
5. Zinflation is when inflation stays the same. It sounds stable but can show a lack of economic growth.
Now that you understand the terms that surround inflation, you are ready to dive into the exact calculations of inflation. It’s crucial to understand that inflation is calculated based on specific economic reports for the CPI or Consumer Price Index, which measures a basket of goods like milk and other essentials. Economists calculate inflation by looking at the prices in the CPI report and then comparing those prices to prior periods. For example, if prices are going up in the CPI compared to last year, we know inflation is rising.
Why is CPI Important?
CPI reports are used by central banks to make decisions about interest rates. If CPI is rising too quickly, it usually points to inflation, and the central bank might raise interest rates to cool down the economy. Conversely, if CPI is falling, central banks might lower interest rates to stimulate spending.
CPI is related to inflation. When CPI increases, it suggests that inflation is occurring, meaning the purchasing power of money is decreasing. This is why central banks monitor CPI closely to ensure that inflation stays within a target range, typically around 2-3%. As a trader or investor, you can use these numbers to better understand how asset prices trade relative to inflation.
Thanks for reading our latest educational post about becoming a swing trader! Be sure to follow us for more updates and educational resources like this.
---Forex.com Team

Cutting The Fed Funds Rate Does Not Necessarily Cause CPI RiseThe chart proves it. Too many times people throw around the theory that cutting interest rates causes inflation. If this were true we would have seen CPI rise considerably from 2009 to 2015 when rates were near zero, yet we did not see anything of the sort occur. In fact, CPI continued to fall throughout this time

FED vs ECB Interest Rate DifferentialIn this chart you can see the interest rate differential for the FED versus the ECB.
I have outlined a possible scenario in rate cuts highlighting a bearish Euro/bullish US Dollar.
If the ECB will cut rates before the FED it will enlarge the differential, which is a bearish outlook for the Euro.

Inflation is not going to go awayI posted in March 2020 that we had likely seen a generational low in yields following the spike driven by Covid fears.
We are now STILL in the early innings of a generational (at least 20 years) BULL market for inflation and yields
Position accordingly over coming years

2024 inflation lower but 2026-2028 might be different trendnote: this is just precaution, a risk management, a bad scenario when happen, and know why it could happen
there an article in twitter posted by Kobeissiletter (the source of picture)
it making similar movement like stagflation which potentially could see a higher inflation later
but we are not in stagflation because inflation and unemployment still low
and based on 1970s there is oil shock too
An oil shock refers to a sudden and significant increase in the price of oil, usually due to a disruption in the global oil supply. This can result from geopolitical events, natural disasters, or other factors that impact the production or distribution of oil on a large scale. Oil shocks have historically had profound effects on the global economy, often leading to economic recessions and changes in economic policies.
The 1970s witnessed two major oil shocks:
1973 Oil Crisis:
Trigger: The Organization of Arab Petroleum Exporting Countries (OAPEC), consisting of Arab members of the OPEC, proclaimed an oil embargo in response to the Yom Kippur War between Israel and a coalition of Arab states in October 1973.
Effect: Oil prices quadrupled, leading to a significant increase in production costs for many countries. This contributed to a period of high inflation and economic recession in several oil-importing nations.
1979 Oil Crisis:
Trigger: The Iranian Revolution in 1979 led to a disruption in oil production in Iran. Additionally, the Iran-Iraq War, which began in 1980, further strained oil supplies from the region.
Effect: Oil prices surged again, exacerbating inflationary pressures and contributing to economic challenges in various countries. The second oil shock reinforced the economic difficulties already present from the first oil crisis.
------------------------------------------------------------------------------------------------------------------
Stagflation:
Stagflation is an economic phenomenon characterized by a combination of stagnant economic growth, high unemployment, and high inflation. Typically, inflation and unemployment move in opposite directions, but during periods of stagflation, both can be high simultaneously, which poses a challenge for policymakers.
In the early 1970s, inflation started to rise, driven by factors like increased government spending, loose monetary policy, and the cost-push effects of rising oil prices.
The Nixon administration implemented wage and price controls in 1971 in an attempt to combat inflation, but these measures were largely unsuccessful.
In 1973, the first oil shock occurred, leading to a significant spike in oil prices and contributing to inflationary pressures.
In 1974, inflation reached double-digit levels, and the U.S. experienced a recession, marking a period of stagflation.
In the latter part of the 1970s, there were efforts to address inflation through tighter monetary policies, but these measures initially had limited success.
The second oil shock in 1979 further exacerbated inflationary pressures.
It was only in the early 1980s, under the leadership of Federal Reserve Chairman Paul Volcker, that a more aggressive monetary policy was implemented to bring inflation under control. This involved raising interest rates significantly, which eventually led to a decline in inflation, albeit at the cost of a severe recession.

CPI CORE RATE maybe a BOTTOM for now I am posting this so all can see the path of cpi based on the core rate No statement yet but it is good to share

Choosing Your Inflation Tracker: Core CPI or CPICore CPI vs CPI - Some say core CPI is a better benchmark compare to CPI data to track inflation.
Knowing which way CPI inflation is going, it will sharpen our investment decision?
If CPI inflation is still trending up, majority of stocks will be under pressure. However, there will be other sectors will benefit from a rising inflation.
In this tutorial, we will discuss what are these inflation sectors and how we can invest or trade in them? And core CPI vs CPI, which one, we should be spending our time tracking.
3 types of crude oil for trading:
• Crude Oil Futures
0.01 per barrel = $10.00
Code: CL
• E-mini Crude Oil Futures
0.025 per barrel = $12.50
Code QM
• Micro WTI Crude Oil
0.01 per barrel = $1.00
Code MCL
Disclaimer:
• What presented here is not a recommendation, please consult your licensed broker.
• Our mission is to create lateral thinking skills for every investor and trader, knowing when to take a calculated risk with market uncertainty and a bolder risk when opportunity arises.
CME Real-time Market Data help identify trading set-ups in real-time and express my market views. If you have futures in your trading portfolio, you can check out on CME Group data plans available that suit your trading needs www.tradingview.com

CPI tomorrowU.S. Consumer Price Index (CPI) tomorrow at 8:30am. If CPI comes in below 3% the stock market will rally strong. If the CPI print is an upside surprise the stock market will go red. If CPI comes in at 3.1% forecast the stock market will whipsaw and then go up.
The Consumer Price Index (CPI) measures the change in the price of goods and services from the perspective of the consumer. It's a key way to measure changes in purchasing trends and inflation. The 2s10s yield curve is a measure of the difference in interest rates between the two-year and ten-year Treasury bonds, which generally tend to trend together with 10s yielding a premium to 2s. However, on rare occasions, the front end of the curve can become inverted as a result of the Federal Reserve (FOMC) policy intervention via raising short-term rates. Historically, an inverted yield curve has been a reliable predictor of an impending economic recession.
Release Date Time Actual Forecast Previous
Jul 12, 2023 (Jun) 08:30 TBA% 3.1% 4.0%
Jun 13, 2023 (May) 08:30 4.0% 4.1% 4.9%
May 10, 2023 (Apr) 08:30 4.9% 5.0% 5.0%
Apr 12, 2023 (Mar) 08:30 5.0% 5.2% 6.0%
Mar 14, 2023 (Feb) 08:30 6.0% 6.0% 6.4%
Feb 14, 2023 (Jan) 09:30 6.4% 6.2% 6.5%
Jan 12, 2023 (Dec) 09:30 6.5% 6.5% 7.1%
Dec 13, 2022 (Nov) 09:30 7.1% 7.3% 7.8%
Nov 10, 2022 (Oct) 09:30 7.7% 8.0% 8.2%
Oct 13, 2022 (Sep) 08:30 8.2% 8.1% 8.2%
Sep 13, 2022 (Aug) 08:30 8.3% 8.1% 8.5%
Aug 10, 2022 (Jul) 08:30 8.5% 8.7% 9.1%
Jul 13, 2022 (Jun) 08:30 9.1% 8.8% 8.6%
Jun 10, 2022 (May) 08:30 8.6% 8.3% 8.3%
May 11, 2022 (Apr) 08:30 8.3% 8.1% 8.5%
Apr 12, 2022 (Mar) 08:30 8.5% 8.4% 7.9%
Mar 10, 2022 (Feb) 09:30 7.9% 7.9% 7.5%
Feb 10, 2022 (Jan) 09:30 7.5% 7.3% 7.0%
Jan 12, 2022 (Dec) 09:30 7.0% 7.0% 6.8%
Dec 10, 2021 (Nov) 09:30 6.8% 6.8% 6.2%
Nov 10, 2021 (Oct) 09:30 6.2% 5.8% 5.4%
Oct 13, 2021 (Sep) 08:30 5.4% 5.3% 5.3%
Sep 14, 2021 (Aug) 08:30 5.3% 5.3% 5.4%
Aug 11, 2021 (Jul) 08:30 5.4% 5.3% 5.4%
Jul 13, 2021 (Jun) 08:30 5.4% 4.9% 5.0%
Jun 10, 2021 (May) 08:30 5.0% 4.7% 4.2%
May 12, 2021 (Apr) 08:30 4.2% 3.6% 2.6%
Apr 13, 2021 (Mar) 08:30 2.6% 2.5% 1.7%
Mar 10, 2021 (Feb) 09:30 1.7% 1.7% 1.4%
Feb 10, 2021 (Jan) 09:30 1.4% 1.5% 1.3%


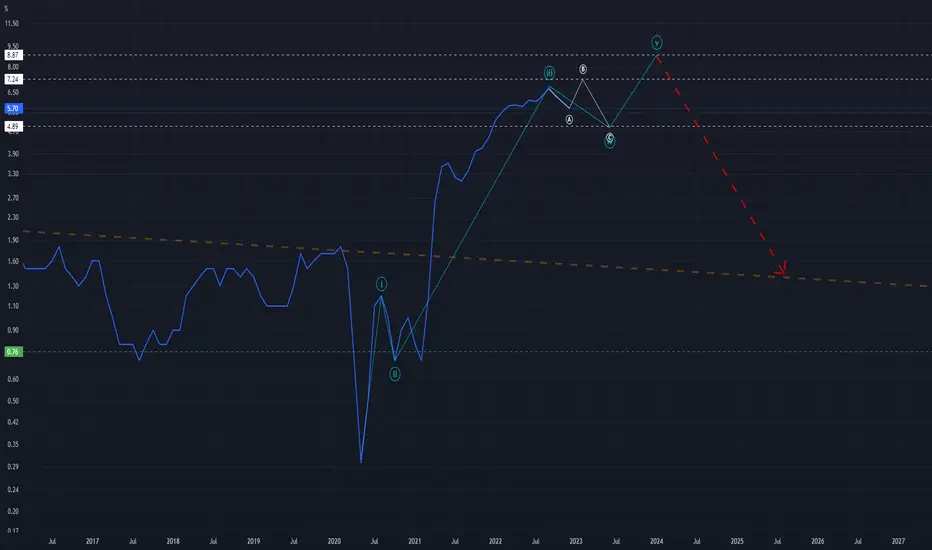
Inflation (CPI) - A Battle Already LostInflation ( CPI ) - A Battle Already Lost
I've recently shared my outlook on CPI and where I think its headed in the months ahead but after further review, it seems that I've previously overlooked certain signals which should have altered my perspective in a way that it did not. Based on discovery of those signals, I have now updated my anticipatory CPI chart to highlight certain levels of interest.
As we can see on the wavemap, the Consumer Price Index (a measure of inflation) has broken above its 40+ year bearish trend line. The breakout was very strong and should be considered as very significant. The format of the wave during this breakout has developed as what seems to likely be a zig-zag formation. Noticeably, the upside zig-zag wave has retraced 90% of the 40 year long bearish drawdown. Therefore, leaving little probability of it being a truly corrective wave. Aside from the macro bear trend-line, I have also highlighted the newly respected bullish trend-line.
Finding resistance near 6.77, Fibonacci measurements suggest that the pending action will fall to retest the former price containing trend line and maybe even drop below it. Specifically, Elliott Wave Theory suggests that 0.99-1.01 should be the downside target range. Over the past 20 years, this level has also supplied nearly unbeatable support. If support is once again discovered near 1.00, the currently active wave could then be sent to retest the red bullish trend, at a level near 9-10.
Ultimately, completion of the blue diagonal will signify that the CPI (and inflation) area headed for upside levels that the American economy has never witnessed. Personally, I believe that inflation is a byproduct of capitalism and there is no true containment possible. The next decade will prove to show if this is on point or simply farce.

Will Jobs data have to suffer in order to get inflation down ?In the 80's it looks like it took very high interest rates to combat the high inflation in the 1980's. With the GOP looking into stopping Bidens spending habits we may possibly be ready for the unemployment to move up and our economy will do some suffering.
Still, Unemployment is low, and inflation is hot. If the jobs data stay sideways this holds the door open for a more hawkish fed.
The large difference in the 80's is we had Reagan in office, and he was not a senile wimp.
I think the Feds are about to step up their game. So get ready traders!

Elliott Wave Science Meets the Consumer Price IndexIt would be awesome if TradingView offered a candlestick chart for CPI but considering its only updated once per month, maybe the line graph/chart is the best option (not sure how that works). As for the data available to me, I've done a best effort markup using the science of Elliott Wave Theory. Considering the fluctuations seen on the M(onthly) chart, I believe its possible that CPI is sitting in the midst of a shallow Wave 4 correction. With this in mind, I find it possible that the number stretches into the low-mid 7.xx range between now and March. From there we may see a 2023 low within the 4.xx level.
I will share my thoughts here as I know there is much interest in "what will the CPI numbers be?"... Being that this CPI data is directly based on the actions of humans and the habits that we act on, it should work pretty well with Elliott Wave Theory. I will keep this post fluid and apply analytical updates as monthly results are publicly announced.
Remember these three important things: 1) trade the chart instead of the news and 2) stay safe /3) don't drown!
Inflation Report: 11 Jan 2023Finally there is a sense of relief.
The US inflation is just on a some-what downward spiral.
It's almost as if we peaked at a whopping 9.1% and now dropping to around 6%.
And let's not forget all our friends abroad, like Germany where it's dropped from 10. 4 in October down to 8.6%,
UK dropping from 11.1% slightly down to 10.7%,
Canada's 8.1 dropped to 6.8%,
France's steady 6.2%,
and China's decent1.6%.
And let's not forget our lekker country, South Africa where inflation has also dropped from 7.8% down to 7.4%.
It's just too bad all these numbers are due to supply chain issues, war, and food shortages.
But it looks like we have potentially seen the end of The Great Inflation - and now things should start to settle.
Your thoughts?
Trade well, live free
Timon
(Trader since 2003)

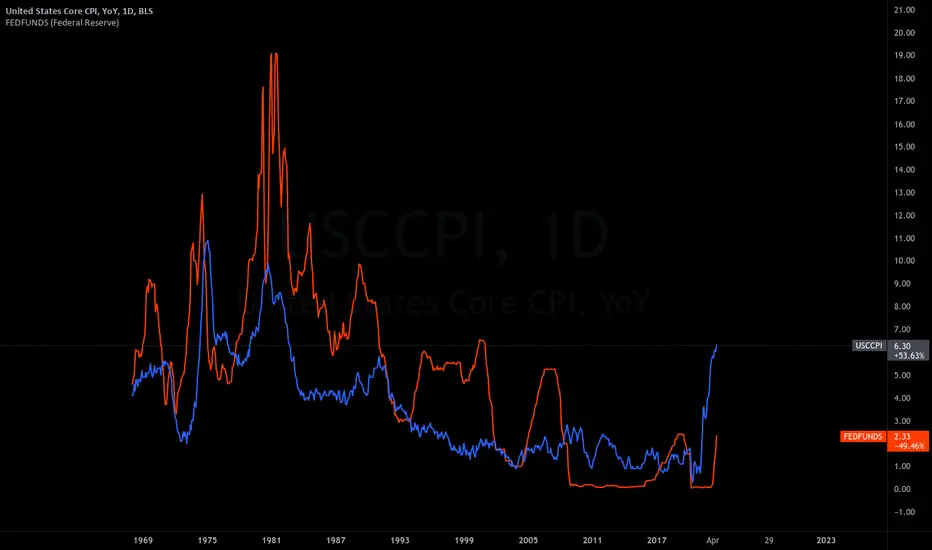
US core CPI vs Fed Funds in periods of high inflation ...US core CPI vs Fed Funds in periods of high inflation ... The Fed has always cut BEFORE core CPI peaked as the chart suggests

INFLATION FIGHT - Pattern changed?Core CPI in blue overlayed with FED FUNDS RATE.
In the 70s and 80s, FFR spikes (RED BOXES) used to fight Core Inflation (YELLOW BOXES)
RED BOXES > YELLOW BOXES to stop inflation historically.
RED BOX before YELLOW BOX
Pattern changed?

Cpi goes up $dxy goes up everything else goes down.This count is based on my assumptions so anything can happen not a trading or financial advice just for educational purposes only kindly do your own ta thanks trade with care good luck.

Inflation always comes fighting back..... NUKE IT. Inflation always comes fighting back. You hit it with a bat, it brings a knife. You Stab it with a knife, It pulls a gun. You pull a gun, It brings a tank... NUKE IT. In the early 1980's Fed Chair Paul Volker raised the federal fund rate to a high of 19%. The inflation rate at that time was well above 10% and had been on and off for almost a decade. As usual this killed confidence in the Fed's ability to keep price stability which led to more inflation. Raising the rate continuously and rapidly is the only way to stomp the nation killer, Inflation. Now we are in a similar position, only we have historical data to use and stop ourselves from creating a decade of higher prices and lack of money for those who need it most. The Fed must swiftly raise our rate above 5%. Swiftly meaning yesterday. Yes, this brings shorter term pain. Yes, this means recession or maybe worse. BUT... Nothing is worse than hyper inflation. Don't believe me? Ask the Germans, it was so bad they birthed Adolf Hitler.

Fed funds rate chasing core inflationPrior to 2008 most of the time the FFR was above core inflation. We are now in a situation that we haven't been in decades where the fed is chasing inflation. The chance of the market breaking in this environment is very high. If you have the patience to wait out these macro indicators like the re-inversion of the yield curve and the catching up of the inflation rate by the FFR i think you will get amazing market deals in all asset classes. The thing is that no on knows how much time it will take. Might take 1 year might take 5 years.
$Dxy $Usd #Cpi MTF TOPPED.This count is based on my assumptions so anything can happen not a trading or financial advice just for educational purposes only kindly do your own ta thanks trade with care good luck.
Tip:
If it happens to be the top. Let's just assume for a moment. Then this means..
If cpi goes down = fed rate goes down
Fed rate goes down = dxy goes down
Usd goes down = gold, btc, eur, jpy, chf, aud, nzd, silver all go up.
Why?
Well it's my assumption but inflation is too high for which fed raises rates.
Cpi is what makes fed decide whether it's gonna raise or not anymore (cpi higher fed raises rates).
If cpi is topped then I don't think the fed rate hike would make any difference in the market because this would be it's final and since (I believe) the market has made it's move already and as you can witness charts having supports on MAJOR tfs I don't think the raise in fed would make much difference or may do the opposite because it's what makes the cpi react that means cpi lags that means fed may not raise the rates as we have topped. Cpi what we have seen today was of AUGUST!!!!!!!!!!!!
So..
Even if the fed raises rates. Then the market would already have moved by then means no reaction because it was already anticipated (or as they say.. Buy the rumors!!!!!!! Sell the Nooz!!!. The news?
Fed is gonna raise the rates.
Anticipation? No surprise, (rate hike anticipated by 0.75 bps !! The market has already been moving as per the anticipation.
Cpi? Of course would FALL.
Means what happens AFTER that? No more raises!!! (My assumptions).
No raise? Reaction? Bonds go up yield goes down usd dxy goes down jpy eur gold silver btc goes up.
Good luck.

CPI-inflation Based on the data, it is unlikely that inflation will decrease, and if something does happen, it will likely be in a direction that can be corrected, not the end.
Follow me, like, comment, and write questions.

CPI_USA CPII did not spend a lot of time on the chart because there is not much information available, but according to this chart, I predict that CPI will increase in the most optimistic state according to the forecasts.As in the DXY analysis, it was clear that the dollar was strengthening
