etc_btc#Etc_Btc
if it will be true best where for exit will be about 12600
for some days
breaking this 2 lines means end of the pattern
and neads new analysis
ETCBTC trade ideas


ETC could go up 7 % or MORE!ETC is just on a major support line. Two options are possible. ETC could bounce on the support, break the other small resistance and go up 7 % or more. Or it could break the support and that's what stop losses are for.

etc_btc 15 min chart#etc blue line is important for 15 min chart
and
use this 2 blak lines for hi and low - trade and sl
breaking each of this lines means pattern ends .

ETC S/R Flip & RSI Divergence - discussion of accumulationGenerally this divergence suggests this is the top. Here we have *just about* broken down out of an ascending wedge (a bearish pattern). This support is now turned resistance and ETC will have to either a) consolidate sideways or decline to support or b) bounce back into this wedge and close inside it to continue its rise.
However, ETC has just recently broken out of accumulation (it has been in a downtrend from 2017 hysteria of a peak of 45 dollars), and the primary trend is BULLish. Anyone shorting is up against over 3 years of constant selling and months of Ethereum Classic changing hands from weak to strong in accumulation!!! CONSIDER WHERE ARE THE SELLERS GOING TO COME FROM TO DRIVE THE PRICE DOWN AGAIN!??!
In my PRIOR CHART I told people to BUY DIGP on BITCOIN CASH because of THIS REASON of NO MORE SELLERS. however, I WAS WRONG and BITCOIN CASH did indeed DECLINE from 0.03 to 0.026soemthing - Daily chop that a short term trader woould be cosnider a losing of money and tying up of capital, but if you HELD and sold off at the recent breakout you could have turned 10 BCH from a 0.3 BTC to a 0.4 - 0.45! not bad for someone want ing a safe trade!!
I have seen multiple LINEAR charts showing with very learned technical analysis that Bitcoin has yet to complete a full C-eliot wave. However on a LOGARITHMIC chart (which you SHOULD be trading off, because we are interested in % return, not dollar amounts) and stock-to-flow, model, Bitcoin is still in a Buy zone and a further decline past the 6K mark looks increasingly implausible.
This is crypto and anything and everything can and does happen, just hedge all your bets!
I will NEVER buy ETHEREIUM AGAIN because they are planning to move to PROOF OF STAKE which is fraught with Problems, ETHEREUM CLASSIC is the ONLY ETHEREUM and CRYPTO CAT TOY DIGIMON CHAIN is just a LEGO BLOCKCHAIN IMITATION!!!
Thank you for Enjoy my SATIRE TECHNICAL ANALYSIS
NOT FINANCIAL ADVICE


ETC/BTC 4H Bearish div. everywhere, ascending wedge, short?Couple of bearish indicators on the ETC/BTC signalling a short-term short?
1. Bearish div with RSI and Stoch RSI
2. RSIs are overbought
3. Ascending wedge
4. Low volume on last candle
I would place a short here with stop loss at above 141k sats.
Last exit would be 110k sats for me.


ETC is correcting before going HIGHEROn the 30 minutes chart, there is a strong support. Placing orders right on the support is wise. Also, the price is correcting from the previous pump. This means that, if the trend continues, price should go higher.

ETCBTC triangleSkipping this one because of the resistance above, but still interested in tracking the performance.

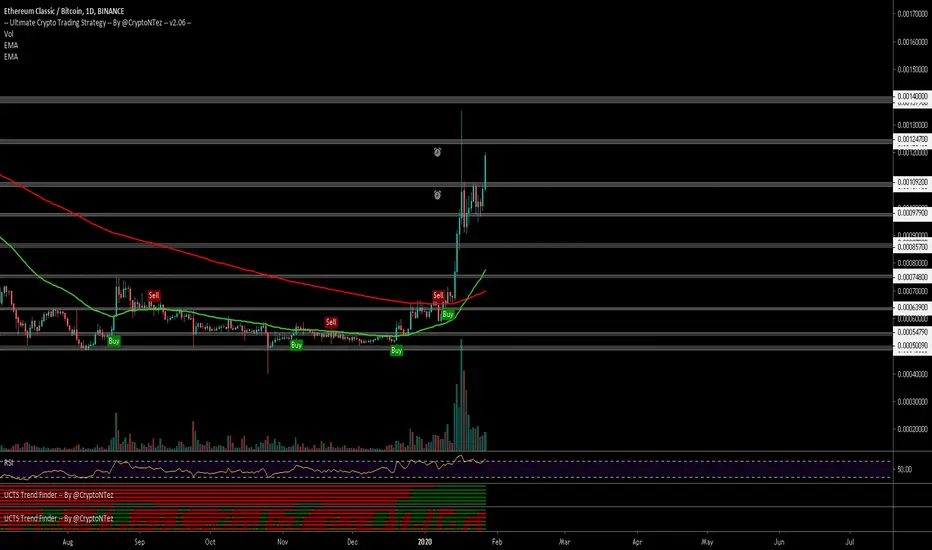
$ETC, Crossing above ~110k sats w/ slowly increasing volume $ETC
Crossing above ~110k sats w/ slowly increasing volume
EMA50/200 Golden cross (last time was around April 2017 Bull Run👀👀)
UCTS Bullish across every HTF (1D-1W)
As inmmediate target ~124k sats resistance level, entering now seems risky aim for R/S Flips or retests
#ETC
ETCBTC - another push?- safe trade when price breaks through trending line AND resistance at 1077 satoshis
- buy: 1080 satoshis
- target: 1325
- profit: 22%

impending trend reversal formingetc is highly bullish, within an overall downtrend, careful watching this play out. but could develop clearer patterns in the coming weeks

ETCBTC Dragonfly DojiDragonfly doji,'is a type of candlestick pattern that can signal a potential reversal in price based on previous price action'.

ETCBTC bullish pennantI am practicing with this pattern.
Similar to BCH
- both extended accumulation
- both breakout at similar times due to news and realisation of value
- symmetrical triangles in both cases
I am expecting upward trend continuation
ETC is ready for another run on the Stoch

ETC/BTC TA Update (Small Bearish Pattern?)ETC/BTC
ETC is painting a bearish small rising channel that has the change to break to the downside
and challenge key support area at around 9800 - 9000 sats which also coincide with the upward trend-line support.


ETC/BTC geri dönüş yapar mı?uzun zamandır takbe aldığım etc/btc yaklaşık 4 ana indikatörün al vermesi, desteğe tutunması ve piyasa koşullarıyla bağlantılı artış beklenir.
son rsi riskli olabilir fakat diğer indikatörler beni yanıltmaz ise çanak formasyonunda 1.hedef 11700 den sonra parçalı kar satışları başlar. 9000-9600 arası toplama eldeki miktarı arttırmaya yönelik fırsat veridiğini bu süreden sonra satıcılara kar bekleme durumuna geçeceğine inanıyorum.

ETC retracingTime to fall. Targets are ~8500 and ~7600. First zone just above 0.382 Fibonacci level is the last one that assumes bullish continuation. If price drop lower, momentum will be lost and ETC will take much longer time to consolidate within same 7000-7700 area.

ETC/BTC TA Update (Pump and Dump?)ETC/BTC
ETC shoots up over 100% price increase in a very short period, this move is kinda scary as no single support is built during this massive move up.
The price can drop faster, be cautious as this coin is highly volatile and risky. Also, ETC is trading within an area of resistance and the candle hasn't closed yet.
Do not FOMO with this type of market move or you will regret joining late.


$ETC, Went parabolic over the last 48hs$ETC
Went parabolic over the last 48hs with a clear spike in volume (exhaustion?) that suggest some retrace on the following hours/days... (80% up.. ⚠️)
If you are hodling, lock profits and look for lower entries, no R/S flips since 63k sats...
#ETC
