ETCBTC trade ideas


ETC BTC Trade IdeaIt is a good time to accumulate some Ethereum classic.
The RSI is in the oversold zone. It may go down a bit more and that would be the best time to pick up some coins.
The upcoming events are:
1. Mobile wallet release June 30th.
2. Emerald SDK release July 31st.
3. JIT compilation August 31st.
4. Second annual meeting will be on September 12th.
Every time it hits the target, cash in and wait for another dip to accumulate more coins.

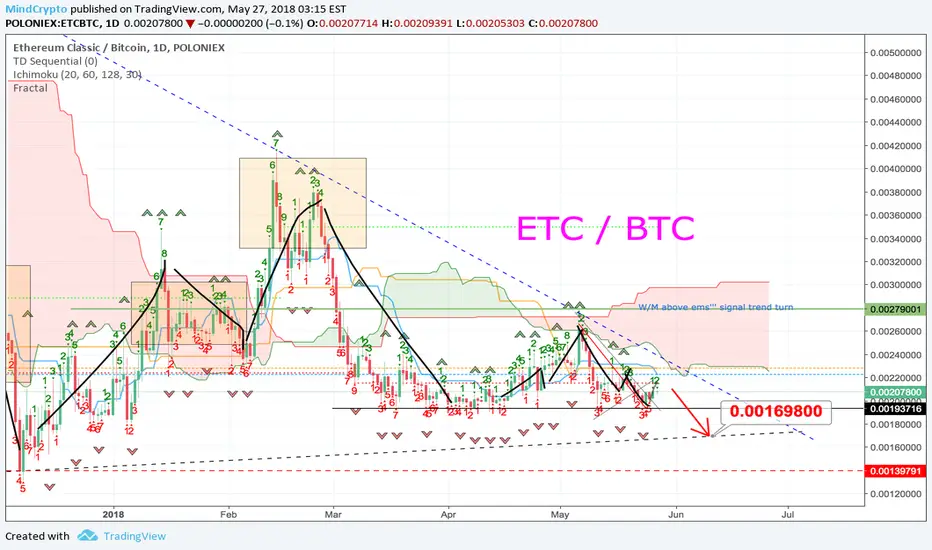
ETC will definitely go upAll the indicators are showing that a bullish turn up will come soon. Get in at around 0.0018 - 0.0019 range. When the market get stabilized, the price of ETC will run up faster than you think.
RSI is oversold.
TD SEQ is at 7-8. Cloud above is thin.
Call-out boxes are the targets for this trade.
Best of luck!


Ethereum Classic. P-Modeling Pt. 1 - Decoding the Global SignalWelcome. This is Geometricc Linear Regression Modeling applied to ETC. This is Part One of creating ETC's algorithm based on my theoretical methodology.
Be sure to come back for updates! Hit that like button and let me know what you think.
I have decided to give my geometricc linear regression modeling another contender. Up until now, my modeling framework has only been applied to Bitcoin, Ethereum, Zilliqa. We are about to add ETC, EOS, Theta and BTC to the mix. These new algorithms being designed are going to feature new constructs in the methodology that build upon the old constructs in Bitcoin and Ethereum. This methodology is about to expand to 12 coins across three algorithm engineers on my team. So keep an eye out for other people actively applying this methodology in TA.
What you are looking at is the 1 Day global signal of ETC and its decoded geometry based upon my foundation theory in my methodology. It is quite beautiful if you ask me..
The idea here is to convince you, that what i am doing is not arbitrary but unique and useful. I know the immediate inclination is to doubt what I am doing. That is expected.. and understandable.. But human nature is unpredictable. And you never know when you can learn new things and be completely shocked at someones EXTREMELY insane ideas.. I like going against the norm.. being different is what makes you stand out.. So stand out from the rest.
Understand I have been making these charts for about 3 months now, that is it.. I do not recommend placing money on my charts, so do not ask me for advice. My background is not financial analysis or trading.I have very little understanding of traditional TA tools and indicators, but i am learning.
Understand that what I am doing is new. It is Theoretical. Thus being it is theoretical, take it with a grain of salt.
I am certain i have found validity in what I am doing, so I will keep doing it. Despite any failures, or incorrect calls, or emotional builds ups only leading to disappointment. Is that not the fun of it? I found this stuff ultra fun and it works a good portion of the time it seems. But I am only human.. Humans make mistakes.
When rendering a model in my algorithm, the proposition that upholds the belief theory is subjective to a degree. I chose the best place I THINK it would go. Period. I follow the geometry as I see it in my eyes. That is subjective. No A.I. in crypyto trading has the ability to have subjectivity. But I do. No A.I algorithm created has subjectivity, unless it is a hybrid that incorporates HUMANS into it's analysis. The human operator is the most important aspect in understanding the real complex nature of human emotion and its interplay in something like crypto trading; as all bots programmed to trade (are based on emotions, and desires of the HUMAN programmer). Thus bots although automatic, ooze the emotional desires of the human programmer. An observable behavioral phenomena, to the train eyed.
The only way you can learn about my technique is to watch what i am doing. YOU WILL FIND THIS NOWHERE ELSE. As this is designed from scratch based off other research I am working on in my professional domain. This is a grand experiment, I thank you for all participating with me! Hit that like button, it lets me know you are watching like a ninja in the background!
If you are confused how i got here.. Please go back and look at my charts. They are sequentially marked by Pt's for easy identification.
As always thanks for looking,
Glitch420


ETCBTC: stick to our strategy, short btcusd but long hereTraders,
This is a support zone on DAILY CHART.
OK, considering the totally bear on BTCUSD and other Crypto currencies, why not try to long some pairs that use BTC as calculated unit?
This is one that showing a broken trend line with several support candlesticks on daily chart.
Try it with stop loss.
Less is more!


ETCBTC Signals Hey guys and welcome to another trade. Lets talk about ETC Or Etherium classic its a strong with lots of upward potential it has a strong breakout so buy near the support which fib level 0.05 and sell strong at target thanks guys for looking into it have a nice day don't forget to leave a like.


ETC BTC - shall we break the trendline?Well, ETC was a pain in the ass lately. may be this time it shall go upper levels. Very good project with no hype at all.


ETC BTC prepare for a BULL runSituation are good for a long entry.
Right now my Long targets are conservative as I will update this chart in future.
There is a big possibility that BTC will start another Bull run and ETC may decline via BTC. Now ETC rate is near lower trend lane.
If we will break down with an impulse and cross black dot line, we are going out of this trade.
Or ETC may keep same ration with BTC until growth will starts again.
It is way too hard predict time range off this chart, but opportunity we have one.

ETC Looking for bullish movement enter price : 203 till 195
stop loss 172
targets as shown in fibo levels
happy profits
Long trade

ETC Binance ResistenceETC was trading below the 50 SMMA. however as you can see the circled it met with plenty of resistence and it has broken down from here. currentl ETC is trading below the 20 EMA and until we dont see a breakout from here we could go down further.

Large degree accumulation on ETC, Effect will be hugeTaking a look at the price of ETC on the weekly.
and my god.
does it look like we are going to have a flat (few years?) after which our markup will be IMMENSE.
reason why?
Cause and effect.
Larger the cause, larger the effect.
Wyckoff suggests that accumulation and distribution are cause zones, and mark up and marke down are the effects.
Say ETC accumulates for a year, the markup on ETC will be huge.
Now's not the time to buy.
Time to buy is when ETC really falls down to like
0.0013 - 0.0016
We will likely bounce between the 2 support and 2 resistance lines (2nd resistnace line might not have even been formed yet, I don't spot an ST that usually occurs in Phase B - although 0.002 might be it)
I'm happy to wait a few months to see what ETC wants to do.
But for now, take a look at the magnificence of the setup we are currently playing out. (almost 10 months since we had our first sign of PSY)
The markup will be immense. This accumulation might take a few years to play out, i definitely want to be there to catch the rocket up.

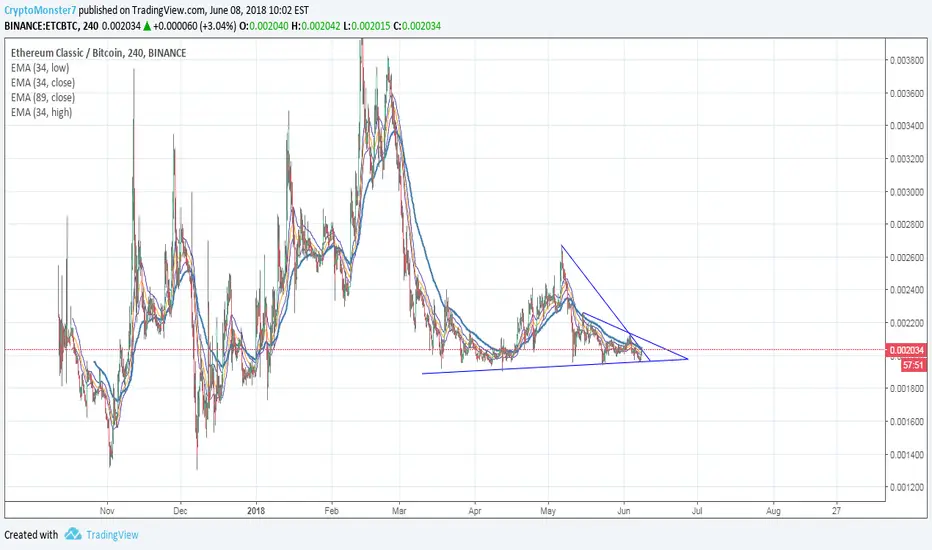
ETC/BTC in Limbo I think we can all agree that the ETC is a slow moving coin. Not much volume. Wish there was more interest as volume would increase thus more volatility. But we'll have to see how investors react to upcoming news from the Dev team.
We saw a test of the support level 0.001973 which lined up great with my descending triangle , bouncing right up. Again, we saw a lack of interest from bulls. A critical point of resistance would be .002277 as this would help it cross the 50 MA as well. An unsuccessful break of this resistance and a break below fib .001970 may take it back to very low levels as low as .0018 or even .0014
We can also see a consolidation of the Bollinger Bands. This may indicate a break out.
Please note the Daily RSI may be indicating further retracement.
Overall we may see more retracement as we follow a downtrend with lower highs and lows.
What are your thoughts? Let me Know :)