It's Happening now to ETH tooPrevious post was 6hr chart, this is 2day waves are visible, circle is point of entry, and the long trade is mapped out too, not financial advice, just what i'm doing, some poeple with big voices don't see this
ETHUPUSDT trade ideas

ETH to $2750 Plotted on this chart is same as BTC chart. some alts ha already seen this retracement, another previos high not tested, 2750 intersects trend and the retest, may just be a one quick wic,k place limit orders with stop loss, may be a last chance dip

ETH : Following BTC, Elliot Correction Wave $2700📉Hi Traders, Investors and Speculators of Charts📈
ETH is currently following BTC along with the rest of the crypto market into a correction wave. By following Elliot Wave Theory, we can find a target for a potential bounce zone for the current corrective pattern.
Ideally, we'd want to see a successful bounce from the 50d moving averages here (green), but a wick towards the 100d (turquoise) will not be unusual:
Here are my thoughts on Ethereum from a MACRO outlook, for future potential targets:
If you found this content helpful, please remember to hit like and subscribe and never miss a moment in the markets.
_______________________
📢Follow us here on TradingView for daily updates📢
👍Hit like & Follow 👍
CryptoCheck
BINANCE:ETHUSDT

ETHUSDT IDEAHello Traders Hope You Are Enjoying Our Analysis. Today We Will Discuss About ETH
(Update)
The Trendline Is Ready To Breakout In 1H⚡️
Incase Of Breakout Expecting Moves Towards 3300-3500$✍️

📈🔥 ETH Trade Opportunity! 🔥📈📊 Analysis:
Daily Chart Support: Ethereum (ETH) is currently trading at a support level on the daily chart.
Entry Range: Consider entering the trade between $2,850 and $3,050.
Profit Targets: Aim for profits at $3,400 - $3,700 or $4,100 - $4,300 resistance levels.
Risk Management: Set a stop-loss just below $2,780 to manage potential losses.
📈 Trading Strategy:
Entry: Initiate a long position within the specified range of $2,850 - $3,050.
Targets: Take profits at identified resistance levels.
Risk Control: Implement the specified stop-loss to control downside risk.
🚨 Note: Keep a close eye on market conditions and adjust the strategy accordingly as the trade progresses! 📊🔍 #ETH #TradingOpportunity #CryptoAnalysis 🌟📈

ETH/USDT long , long TimeIn the next 12 to 18 months, I think Ethereum will be worth more than or equal to Bitcoin. I have reasons for that.
at the long time
TP
7000
12000
15000
24000
32000

bbhow beautiful it is !!
when price have consolidation term bb really can help u
i know its risky to take trades that upside of trend and its have more risk tho but with standard division analysis u can take some of those

ETHUSDTETHUSDT is in strong bearish trend.
As the market is consistently printing new LLs and LHs.
currently the market is retracing a bit after last LL, which is 50% Fib retracement level and local support as well. if the market successfully sustain this selling confluence the next leg lower could go for new LL.
What you guys think of this idea?

#ETH seems like is ready for the upside moveAs visible in the chart, we have a well-established bullish trend and market structure in the daily timeframe chart of ETH.
Following the formation of a top on March 12th, 2024, the price initiated a corrective bearish move, corresponding to an ABC zigzag correction and retracing approximately 61.8% from the previous bullish move.
Furthermore, the price has also reached a bullish trendline, which could act as static support.
Additionally, tomorrow, on April 19th, we have the halving event, which has historically brought buying pressure to ETH.
If you've found this analysis helpful, please take a moment to like, comment, or share your thoughts with me.

ETHUSD4HETHUSD 4H
orderblock/bos/lightning correction matching with the fixed liquidity bullish rsi divergence and a fibo time channel

ETHUSDT Price Dips, Possible Rebound ExpectedHi There,
The price of the ETHUSDT has dropped to 3300 and looks set to drop further to around 3100. A possible rebound is expected based on the low point of April 12, 2024, and the key level to watch is 3201.30 for a potential uptrend.
There is a significant bearish trend on the Daily timeframe, and if the price falls below 2958.03 then the setup will be invalid.
Happy Trading,
K.

ETH 1D LONGI invite you to review ETH on a one-day interval. Let's start with the current rebound, as you can see the price has dropped to the first buying zone, and when BTC stays above the $60,000 level, we may see prices rebound in the coming weeks. Next, we have a defined purchasing level 2, and then another very strong zone for price fairization, but I do not expect such large drops.
The green color shows the ranges of levels that I expect in the next months of the bull market.

ETHUSD WILL RETRACE MORE !!!HELLO FIRENDS
As i can see ETHUSD is now trading in down trend for looking a strong support zone to make a new higher high so we are expecting this Fib retracement to the 0.61 level is possible and can be a easy target so do not miss the train from selling zone area its overbought now and should be go to given levels its just a trade idea share ur thoughts with us
Stay tuned for more updates

ETH 2 Day Waves?I don't trade them, but will help assess where BTC may be headed.
On the 2 day you can clearly see 5 wave count down, then by theory, there should be a 3 wave correction, up, smaller, we've seen 2 of them, up and down, should be another up-side, but then I think ETH gets one more 5 waves down to the white line previous tops and in the 61.8-78.6 fibarea, for a wick only


ETH/USDT - Bearish Signs1:Far away from 200 Moving average
3:Hit strong resistance at 3913 level
after a good long bull run pullback must be happen wait and see these levels and see what happen
2686
2141

ETH/USDT trend - Critical support zone will act?hi guys.
this a a technical analyze for BINANCE:ETHUSDT
as i see there is a nice uptrend channel for Ethereum.
any daily close below yellow trend line at ~2840$ , can be a trend-change signal for me and then with high probability we will see ETH at 2000-2050 support line. and if this critical support also break, so i think whole crypto ( especially AltCoins ) will go for a big correction not only in price but also in time.
lets see what will happen . ;))

HelenP. I Ethereum can break trend line and continue to fallHi folks today I'm prepared for you Ethereum analytics. If we look at the chart, we can see how the price some time ago started to trades in consolidation, where the price in a short time declined to the resistance level, which coincided with the bottom part of the range with the resistance zone. After this movement, ETH some time traded near this level and then started to grow to the top part of the consolidation, and when the price reached it, Ethereum turned around and started to decline. In a short time, the price fell to the 3245 resistance level and soon broke it, thereby exiting from consolidation, but later price tried to rise higher and soon failed. Then ETH declined to the trend line, after which it started to move up and in a short time it rose to the resistance level again, but recently the price turned around and declined back. Just now, ETH continues to trades very close to the trend line and I expect that Ethereum will rebound from the trend line and then start to decline even lower this line, breaking it. That's why I set my target at the 2865 points. If you like my analytics you may support me with your like/comment ❤️

ETH MEDIUM TERM VS LONG TERMHello Traders and everyone, I am Hadi Karaali, Known as SNIPERS_FX
If you like the idea, do not forget to support with a like and follow.
ETH MEDIUM TERM VS LONG TERM. 📚
👉As we can see price is still overall bullish from a long-term perspective, trading inside this rising broadening wedge pattern, making clean higher highs and higher lows.
👉Moreover, We are still bearish from a medium-term perspective, trading inside this orange channel, Meanwhile, price is sitting around first our strong support zone, lining up with our lower bound of this channel, acting as an over-sold zone, where we can expect rejection movement toward the upper falling trendline.
If you like this kind of analysis don't forget to like and follow
and as usual follow your trading plan and manage your risk.
Be patient and good luck!

Ethereum(ETH): Re-Testing Broken ZoneEthereum is showing some strong re-testing after the breakdown of local support. Our attention is now at the current re-test and also at the upper resistance zone near $3665, which should be touched only if we see a breakout from the current re-test.
Swallow Team

Can the market continue to fall?📊 According to the selling pressure in the market, if the range of 3030 units is broken and the price stabilizes below it, the price may fall to the range of 2970 units🎯, and in the case of the strength of the range of 2900 units🎯🎯.
📊 Otherwise, the possibility of price increase up to the range of 3250 units.

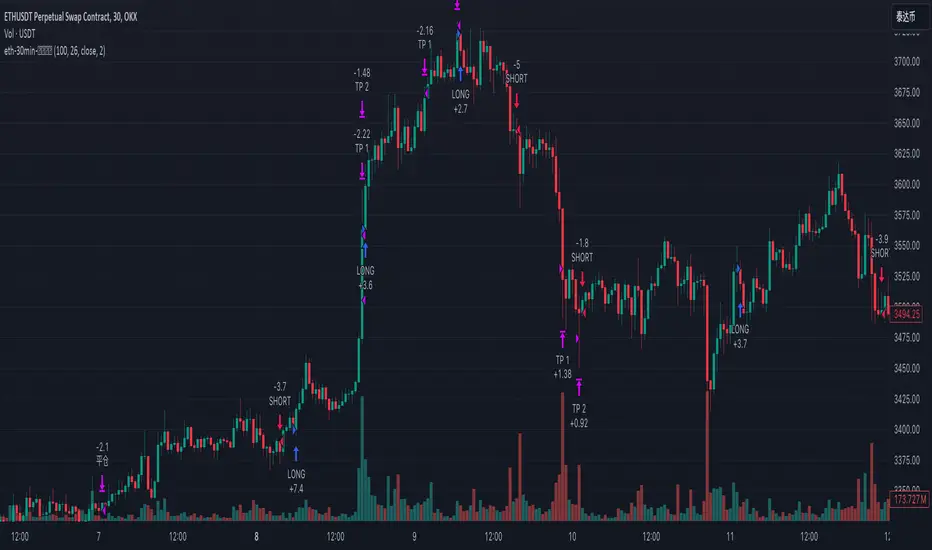
eth-usdt strategystrategy eth-usdt
Automatic trading strategy, eth-usdt contract 30-minute trading pair.
ETH is Pointing Down For a Bigger CorrectionETH is Pointing Down For a Bigger Correction
ETH broke out of a strong bearish pattern thus indicating a bigger bearish wave.
The price doesn't seem in a rush to decline right now.
I think that ETH may test the broken support area now turned into resistance before it moves further.
We can see ETH lose value as it appears in the chart.
You may find more details in the chart!
Thank you and Good Luck!
❤️PS: Please support with a like or comment if you find this analysis useful for your trading day❤️
