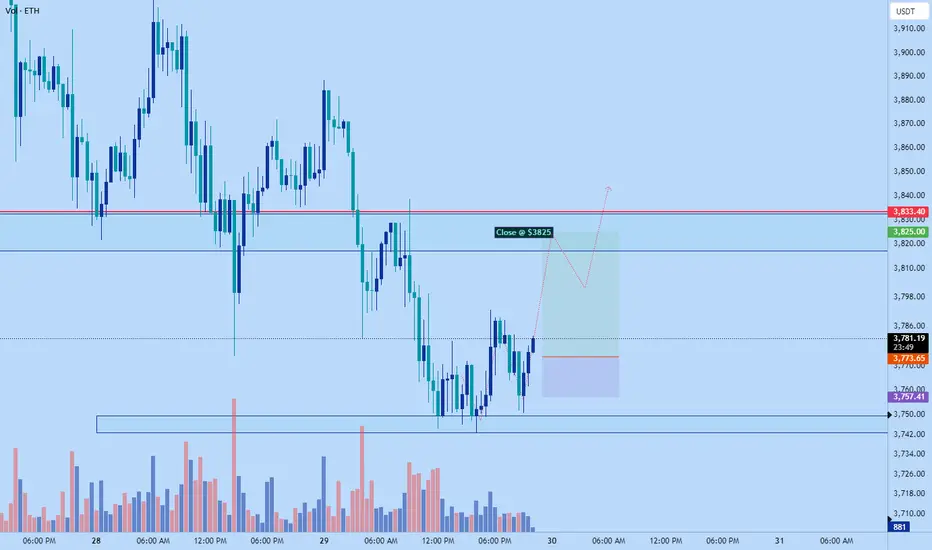
Eth take off now target $3825Eth is getting ready to push up. Price is at a low showing signs of reversal>
Target area $3825
Roughly 2.5-3RR depending on entry from current price.
ETHUPUSDT trade ideas
ETHUSD SHORT IDEARisk warning, disclaimer: the above is a personal market judgment based on published information and historical chart data on Tradingview, all analysis is only subjective. Hope investors consider, I am not responsible for your investment decision. Thank you.
Good luck!

ETHUSDT-Bullish Wave Coming Soon Detailed Analysis of #ETHUSDT
Time Frame: 1 Day (1D)
Overview
ETH/USDT has recently broken out of a falling wedge pattern, a bullish reversal pattern. This breakout indicates the potential for a substantial price increase, with an expected bullish move of up to 40% in the coming days.
Key Elements
Falling Wedge Pattern:
The falling wedge pattern is characterized by two converging trendlines that both slope downwards. This pattern forms when the price consolidates and the volatility decreases, indicating a potential reversal.
The breakout above the upper trendline of the wedge suggests the end of the previous downtrend and the beginning of a new upward trend.
Pattern Breakout Confirmation:
The breakout from the falling wedge has been confirmed, signaling a shift in market sentiment from bearish to bullish.
This breakout is a key indicator that the price is likely to increase as the market dynamics have shifted in favor of buyers.
Volume Analysis:
A significant increase in trading volume accompanying the breakout is often a key confirmation signal. It indicates that the breakout is supported by strong market participation and investor confidence in the new trend.
Sustained higher volumes post-breakout are crucial for the continuation of the uptrend and to validate the breakout.
Historical Price Behavior:
Analyzing historical instances of falling wedge breakouts in similar market conditions can provide insights into the potential price movement.
Historical analysis can help validate the anticipated magnitude of the price increase and the timeframe over which it might occur.
Market Sentiment and Fundamentals:
Broader market sentiment can significantly impact the price movement of ETH/USDT. Positive developments in the cryptocurrency market can bolster the bullish outlook.
Fundamental factors specific to Ethereum, such as network upgrades, increased adoption, and positive news, can act as catalysts for price increases.
Monitoring news and developments related to Ethereum is crucial for anticipating potential market reactions and understanding the drivers behind price movements.
Risk Management
Stop-Loss Orders:
Implementing stop-loss orders below the breakout point of the falling wedge can help protect against potential downside risk.
A recommended stop-loss level could be set at 5-10% below the breakout point to account for market volatility.
Position Sizing:
Ensure that your position size is consistent with your overall risk management strategy. Avoid over-leveraging and manage your exposure to maintain acceptable risk levels.
Proper position sizing helps mitigate the impact of potential losses on your overall portfolio.
Take-Profit Levels:
Establish take-profit orders at intervals that align with the anticipated 40% price increase.
Consider scaling out of the position incrementally to lock in profits and reduce the risk of market reversals.
Conclusion
The breakout from the falling wedge pattern in the daily timeframe for ETH/USDT suggests a bullish outlook with the potential for a 40% price increase in the coming days. This bullish expectation is supported by the confirmed pattern breakout and strong volume signals. Nonetheless, it is essential to remain adaptable to changing market conditions and employ robust risk management practices to protect investments.
Note: Cryptocurrency trading involves significant risks. Conduct thorough research and consider consulting with a financial advisor before making any trading decisions.

Let's hope ETHEREUM DOES NOT do THIS 😨BINANCE:ETHUSDT
Ethereum is looking bullish after a strong bounce and a successful retest of the support zone at 2800.
According to all Fibonacci logic, we SHOULD be hitting the 1.618 zone SOON. But we're not out of the woods just yet. There's a risk of a very bearish pattern forming IF we cannot close the daily ABOVE our previous resistance zone. This would form a nasty M-Pattern that could takes us back to 2800 and even lower.
Technical indicators are extremely bullish right now, but this does not guarantee that sellers aren't waiting for us around the corner at 4000.
Naturally, we can expect ETH to keep on following BTC closely over the next week. If Bitcoin makes another leg up, Ethereum will soon follow a day or two later.
_______________________________

ETF approval will pump ETH price to a new ATHHi everyone,
After consolidation within 3000 - 2800 support area Ethereum price skyrocked on the news about possible ETH ETF approval. Few days ago ETH ETF has been approved and Ethereum price continue to rise even though Bitcoin price is slowly declining.
If Bitcoin price won't dump in the coming days then I expect Ethereum rise at least up to local high at 4080 price level but even if there will be some correction on Bitcoin I don't think that ETH price will significantly dump.
There is one thing to note about ETH ETF. Even though it was approved, the real trading will start at least one month later, so there is room for Ethereum price to go up or down before ETF trading starts. But overall ETF approval is a higly bullish news for Ethereum and most likely it will pump its price to new all time highs.
Please, do not forget to boost this idea & share it with your friends; thanks.

Eth trade ideaI am bullish on Eth since last month as per my previous Ideas. Now again its forming a good entry for long. Below PDL (Previous Day Low). is liquidity trap zone and also equal lows. I am looking for that area zone to be filled then I will look for long trade. I took help by SMC indicator.

Ethereum (ETH): What Now After ETF Approval? Ethereum is back at a major resistance zone where we see big similarities with the Bitcoin ETF.
The price is still showing slow bullish signs near the major resistance zone, where there might be one last "push.".
We are now looking for a potential rejection to happen from that zone, which would result in a nice downward movement!! For now, all we can do is wait and keep monitoring!
Swallow Team

Chart Elements and Key Observations of $ETH.Price Levels:
Current Price: The current price of ETH is 3,817.20 USDT.
Support Levels: The chart shows two key support levels:
Around 3,795 USDT (marked by the blue dashed line).
Around 3,762 USDT (marked by a solid black line).
Resistance Levels:
Around 3,914 USDT (marked by a solid black line).
Trend Lines:
Downward Channel: The price is moving within a descending channel, indicated by two black downward sloping lines.
Volume:
Volume bars at the bottom of the chart show trading activity. Recently, volume appears relatively low, indicating possibly less trading interest or a consolidation phase.
Technical Indicators:
MACD (Moving Average Convergence Divergence):
The MACD line (blue) is crossing below the signal line (orange), which can be a bearish signal indicating downward momentum.
RSI (Relative Strength Index):
The RSI is at 46.40, which is close to neutral (50). RSI below 30 generally indicates an oversold condition, while RSI above 70 indicates an overbought condition. Currently, the RSI suggests neither overbought nor oversold conditions, but leaning slightly towards the lower end.
Potential Scenarios:
Bullish Scenario:
If the price breaks above the upper trend line of the descending channel, it could indicate a reversal of the downward trend, potentially targeting the resistance level at 3,914 USDT.
Bearish Scenario:
If the price fails to hold the support at 3,795 USDT and further at 3,762 USDT, it could lead to a further decline, with potential next support levels at or below 3,719 USDT.
Neutral/Consolidation:
The price could continue to trade within the descending channel, oscillating between the support and resistance lines, indicating a consolidation phase until a clear breakout (upwards or downwards) occurs.
Conclusion:
The chart shows that Ethereum is currently in a descending channel with important support and resistance levels identified. Monitoring the breakouts from the channel and the behavior at support levels can provide clues about the next price direction. The technical indicators suggest slight bearish momentum but are close to neutral, indicating indecision in the market.


ETH sligh LongI am looking out for this retail setup to play. With a feasible stretch for a longer pump. I am more confident of a 4k for eth tomorrow

#Eth Impulse drop to $3700Waiting on entry confirmation to short #eth.
Target is $3700 based on head and shoulder which also aligns with another confluence however I'll be looking to exit earlier at $3750 support.
I'll update when I enter(Likely 1:45 pm to -2pm). Anticipating an impulse quick drop...doesn't have to playout that way though
Short setup invalidated above $3900
Also. The head and shoulder is just 1 confluence that's easy to understand so thought I share. I mainly trade base on structure and key support and resistance areas, W volume, fibs , ema confirmations.
This not meant to be long term trade, just a corrective short down to daily support area.

eth usdt to 52001st on the weekly time frame the Stoch's are low
strong support at 3660 I would put my stop loss a little below
front running the golden cross on the 12 hour time frame
the ETF was approved gunner ride the hype bitcoin went up 90% after the 3 months or so
I'm looking at the high time frames so this move is Gunna take some time
once its touches the 21ma we should be good for a move god bless

Waiting on Eth LongI'm looking to long eth around 9:30 est to 11 am est.
Around $3900 level or preferably at $3865
Trade idea invalidated below $3820
Target 1: $3960
Target 2: $4060
I'll keep an open TP and look to take profit manually around those areas or hold for higher all the way up to $4600 depending on PA.
I won't just enter at above entry prices either , I'll only do so after a few more confirmations.
I'll update when I enter or if I'll wait some more.

ETHUSDT Breakout TradeETHUSDT is moving in range, wait for the breakout to get trade or place your buy and sell stop with given Tp's.
Mange your risk according to account size!

ETHEREUM → The coin comes to life. Target 4,000?BINANCE:ETHUSDT is forging a retest of the key support area. On the background of NFP publication, the coin grows following the flagship - BTC and tests 3130. We are waiting for a retest of 3200.
An interesting promising candlestick pattern is forming on W1 on the background of the retest of the key support, which is the resistance of the previously broken ascending channel. The Chart clearly shows how the market is gathering liquidity at the expense of sellers, which is generally an encouraging pattern with the goal of further growth. On D1 it is worth paying attention to the triangle boundaries, as well as to the 3200 area, a breakout and subsequent consolidation above which will form a strong bullish potential that can continue to grow to the interim high of 4086, as well as to the ATH.
Support levels: 2900, 2812
Resistance levels: 3200, 3350
Technically and fundamentally, ETH has a good potential. The phase of realization of the accumulated energy can be activated at the breakout of 3200. Also, on a bullish trend symmetrical triangle is a good and potentially promising pattern.
Regards R. Linda!

EthereumI am taking Ethereum long. Risk is clearly defined, and I believe there is good upside to be had.
I have been filled at $3,027

Starlight Analysis
Machine Learning Predictions: AI-based buy/sell signals.
Cooldown Period: Ensures minimal noise and false signals.
Advanced Visualizations: Clear and interactive 3D data maps and energy flow graphs.
Performance Metrics:
Accuracy: 81%
Precision: 78%
Recall: 81%
F1 Score: 80%
Backtesting Results:
The backtesting
Current Market Analysis:
The latest prediction indicates a strong buy signal for ETHUSDT . This aligns with the observed upward trend and the positive momentum in the current market.
Feel free to adjust the content as per your specific requirements and add the image links appropriately. Once you're happy with the content, you can publish it directly on TradingView.
Hashtags:
#Crypto #ETHUSDT #TradingStrategy #MachineLearning #TechnicalAnalysis #TradingView #AI #AlgorithmicTrading #CryptoTrading #Finance

Bearish divergences on $ETH chart#eth #ethereum price moving in ascending channel and formed bearish divergences. The divergences played out with minor dumps but what's the next?

ETH PriceThe second largest cryptocurrency, Ethereum (ETH) coin has backed momentum and pumped up over 25% this week.

Alikze »» ETH | Rising waveIn the weekly time, it is moving in an ascending channel, which after a complex correction and higher floors has formed a runner zone, which can now complete an ascending wave in the specified area, which is the supply area. Therefore,
🔰 in the first scenario, I expect a correction with the support of the $2,500 area after touching the zone, which can appear more in the form of price, considering that the recent correction was a running zone, and then enter the upward phase.
🔰But the second scenario can break this wave of the region and continue the upward path after the pullback.
»»»«««»»»«««»»»«««
Please support this idea with a LIKE and COMMENT if you find it useful and Click "Follow" on our profile if you'd like these trade ideas delivered straight to your email in the future.
Thanks for your continued support.
Sincerely.❤️

ETHUSD uppbreaking downtrend with impulsive move and formation of FVG .. so hunt buy opportunity 🐱🏍

ETH - Critical Zone 👀 Again!Hello TradingView Family / Fellow Traders,
As per my last analysis, ETH rejected the $3000 support and traded higher.
What's next?
Scenarios:
1️⃣ Bullish - Continuation
For the bulls to maintain control, a break above the $4,000 - $4,100 is needed.
In this case, a movement towards the $4,500 resistance would be expected.
2️⃣ Bearish - Correction
Meanwhile, the bears can still kick in for a correction towards $3,500 where we will be looking for new short-term buy setups.
Which scenario is more likely to happen first? and why?
📚 Always follow your trading plan regarding entry, risk management, and trade management.
Good luck!
All Strategies Are Good; If Managed Properly!
~Richard Nasr
