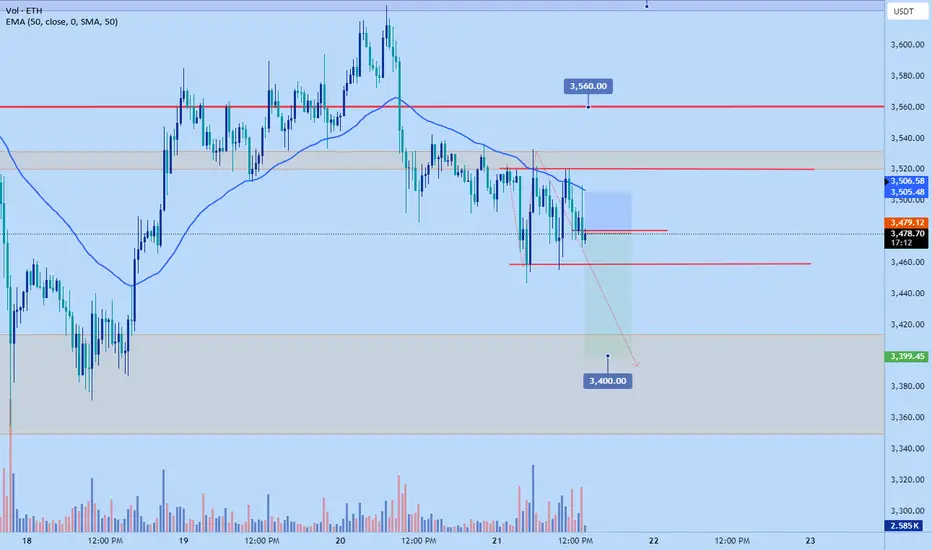
Eth short back to $3400Prior eth long scenario got invalidated. Now I think the price will continue to trend lower after seeing strong selling pressure coming in and rejection of higher prices above 3500 area.
Daily,4hr,1hr and 30 min tf trending down.
Target is next main support at $3400 area.
ETHUSDT.P trade ideas
ETH - UpdateOur box didn't hold, we swept the previous low and are currently grinding down again.
The market is looking horrendous overall: we have 2 big spot buying twaps going on on BTC, while price keeps grinding down. Obviously that takes the entire market down as well, so it's impossible for ETH to catch a decent bid here.
Since it seems to react well off EMAs recently, I used these to give a general outlook about where we are and what 'working ranges' we might expect going forward.
I'm slowly positioning long on ETH through longer dated calls (from end of July through end of year). The expectation is to DCA in here and sell a big portion on the first big IV spike.
You can expect IV to go up into the event and come down after, so since I'm banking on IV to offset time decay and not really hoping on significantly higher prices, I need to be out before the actual event, because it reduces uncertainty and therefor should decrease implied volatility (IV), which has a big impact on options pricing.

"Expert Tips for Selling Ethereum (ETH): Maximize Your Profits!"Topics Covered:
Understanding Market Trends
Timing Your Ethereum Sales
Risk Management Techniques
Maximizing Profits with Smart Trading Strategies

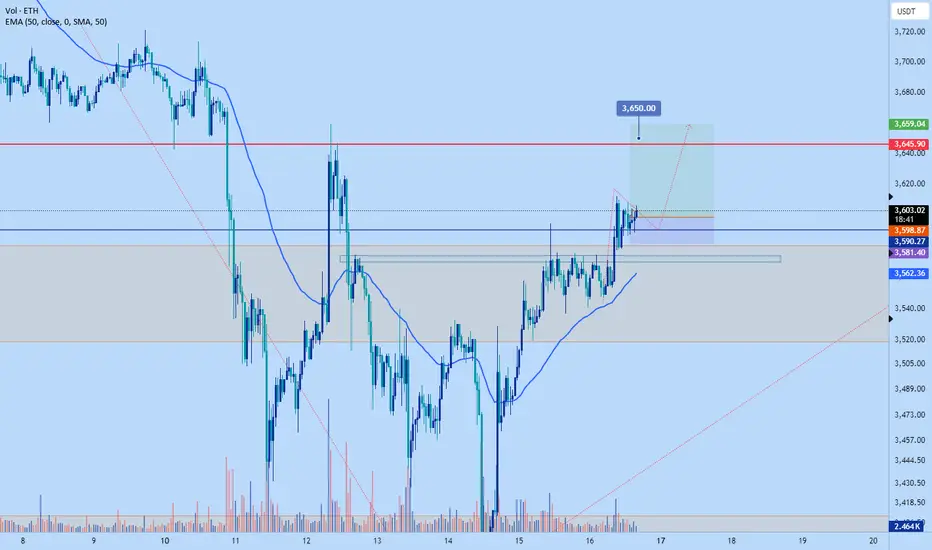
Eth to pump to $3650 by EODI'm anticipating Ethereum to make and impulsive push to close the week above $3650
Stop $3581 or lower
Target :$3650-$3660
Roughly 3 RR trade.
I trade price action, trends, support and resistance with confluences like volume, certain time of day, fibs and EMA . I don't have any fundamental theory as to why the price will go up or down other than demand being more than supply or vice versa.

ETH: Reaction to leve-priceAnalysis by ahmadArz📊 ETHUSDT
This chart represents the Ethereum to Tether (ETHUSDT) pair on a 4-hour timeframe. The analysis of the chart includes several key price levels and potential price movement patterns.
1. **Key Price Levels:**
- **$3950.23**: A strong resistance level where the price has reacted in the past. 📈
- **$3720.77**: Another resistance level near the current price (3736.24). 📊
- **$3410.90**: A support level to which the price might return. 📉
2. **Potential Patterns:**
- Two curved arrows indicate two possible scenarios:
- **Bullish Scenario**: If the price breaks above the $3720.77 level, it is likely to move towards the $3950.23 level. 🚀
- **Bearish Scenario**: If the price fails to break the $3720.77 level and declines, it might reach the support level of $3410.90. 🔻
3. **Reaction to Price Level:**
- The text on the chart "Waiting for reaction to level-price" suggests that the analyst is waiting for the price to react to the $3720.77 level to decide which direction the price will move. ⏳
4. **Black Arrows:**
- The black arrows on the chart indicate key points where the price has reacted in the past. 📍
In summary, this analysis suggests that if the price can break the $3720.77 resistance level, it will likely move towards the next resistance at $3950.23. However, if it fails to break this level, it might return to the support level at $3410.90. The analyst is waiting for the price reaction at these key points to determine the next direction.

Summer BreakoutETH weekly chart is tightening up as we approach the ETH ETF approval that is estimated to be July 2. Last time we based under ATHs (left side of chart), altcoins got wrecked similar to today, but what came next was the start of some wild moves in the crypto market.
Head up, time to focus.

This is ready to explode
How high can this go?
(IMO, Target = $ 10k)
Wave degree:
Primary: Wave 5 (larger degree),
Intermediate: Wave 3,
minor: Wave 3 (Impulsive rally),

#ETH head and shoulders structure is not established📊#ETH head and shoulders structure is not established❌
🧠Although we broke through the downward trend line, we still chose to fall in the end. The expectation of the bullish head and shoulders structure also failed, so the long orders we made based on this expectation were triggered to stop loss. Although it has fallen below the low again, we are currently in the buying zone. I will not chase shorts in this zone. Even if I want to go short, I have to wait for a rebound to occur before considering it.
➡️If we continue to fall, then we can just wait in the support area below. ☕️
Let’s see 👀
⚠️Don’t forget risk management⚠️
✔️Trade Security✔️
🤜If you like my analysis, please like 💖 and share 💬
💕 Follow me so you don't miss out on any signals and analyze 💯
BINANCE:ETHUSDT.P

ETH wait for 3000 for buy/longCMP the price at eth is going side ways incase the price starts making lower low and lower high on daily time frame, then follow the structure and wait for change of trend at the zone of 3000 where we have a order block and we can if we see impulsive move towards it will be target for 4250

Will ETH make or break current support1. Support and Resistance: The Battle Lines
Support Levels: Imagine these as invisible safety nets beneath ETH’s feet. When the price stumbles, they whisper, “Fear not, hodler!”
$3,120 Zone: A cozy spot where ETH sips chai and says, “I shall not fall further!”
100-hourly Simple Moving Average: The trusty sidekick keeping ETH steady.
Resistance Enchantments: These are force fields above ETH’s head, fending off bullish ambitions.
$3,280 Zone: The gateway to moonland. If ETH breaks through, fireworks!
$3,800: The mystical number where resistance dances. It’s like a bouncer at a VIP party.
2. Accumulation Spells: Whales and TVS
Crypto Whales Unite!: Whales amass and stake ETH. 🐋
Recent hefty withdrawals from Binance—$7.2 million and $16 million—straight into staking accounts.
ETH price surged by 5% in 24 hours. Magic in action!
Total Value Staked (TVS) Rising: Climbed to 29,551,488 ETH—that’s $40,839,680.
Investors withdrawing from exchanges, holding ETH for the long haul.
Remember, fellow crypto wizards, ETH’s journey is full of twists. So grab your wands (or trading apps) and chant, “Bull or bear, we ride together!” 🌠✨
#EthereumMagic #CryptoAnalysis #HodlOn

ETHUSDT Shor Position (15 Jun)Hello my friends.
ETHUSDT is in down trend in low TF. And I will open short position like this

ETH - Retest 3400$Think we will see a retest of ~3.4k coming days. I am aware thas most people probably think it won't happen, it's too low, ETF bla bla, but I just ignore everything almost all the time and just look at the charts :)
I have traded the breakout from 3k to 3.6k and I'm flat currently but I think ETH is clearly not done yet but I won't buy at current prices.
Stay safe!

$ETH #Ethereum Trading IdeaETH/USD (Ethereum) price still holds on a $3,450-$3,500 support level. Waiting for a breakout like the last time. This bullish setup is invalid if this support won't hold the price. Then there is a huge probability of retesting the $2,920 support level. Be safe out there!

ETH 4h -ICTETH look a little more bullish than BTC. we bounced from a high probability area and created a mss but I don't like the price action, im waiting for more volatility and I want to see if the 4h breaker holds. if it does then I will look for longs

#ETH callback expected still exists📊#ETH callback expected still exists⚠️
🧠Currently we are near the phased support zone, so it would be reasonable to consolidate here for a while. It’s easy to see from the chart that we are in a downtrend, so be cautious and conservative on the bullish side.
➡️From the perspective of wave theory, wave 4 has been completed and wave 5 is expected to appear. 🙏
Let's see 👀
⚠️Don’t forget risk management⚠️
✔️Trade Security✔️
🤜If you like my analysis, please like 💖 and share 💬
💕 Follow me so you don't miss out on any signals and analyze 💯
BINANCE:ETHUSDT.P


Ethereum Price AnalysisETH is at $3,616.49 has struggled to sustain its position above the $3,669.57 support, showing that demand is declining at higher levels.
However, the upsloping 21-day EMA ($3,669.16) and the 55-day EMA ($3,478.51) indicate that the bulls are still in control. If the price rises from the current level and moves above $4,093.92, the price could rally to higher levels.
On the other hand, if the price breaks below the support zone in blue and 21-day EMA, it will suggest that the bulls have given up and are booking profits. That might push the pair down to the 55-day EMA ($3,478.51).

Ethereum Outlook ICT Consept📈💰 Welcome to Your Channel!
Welcome to your very own channel! Here, we embark on a collaborative journey to analyze and scrutinize financial markets, aiming to achieve substantial profits together. Today, let's dive into the exciting world of cryptocurrency, focusing on Ethereum .
📉🔍 Ethereum and Bitcoin Correlation
As you can see on the chart provided, Ethereum's movements mirror those of Bitcoin. This is because they are correlated pairs, often moving in the same direction or exhibiting similar price action.
🌟📈 Smart Money Technique
Comparing Ethereum to Bitcoin, you'll notice an SMT (Smart Money Technique) , which signals a potential bullish reversal. This suggests that we can expect a price reversal from the lows due to the presence of SMT.
🚀📊 Bearish Fair Value Gap Analysis
Additionally, the SMT candle has formed a Bearish FVG (Fair Value Gap), indicating a likely price reaction. If we observe a lower timeframe setup and enter a long position today, we can anticipate the price reaching the CE (50%) level of the FVG. After this, we should take partial profits and trail our stop-loss, awaiting further price action for more insights.
📊📉 Bullish and Bearish Scenarios
Overall, we can expect a bullish movement for Ethereum. However, if the price fails to rise and continues to decline, we've marked critical levels, including the SSL (Sell Side Liquidity) below the SMT, and a significant unfilled FVG. We can expect a price reaction at these levels.
🚀📈 Stay Tuned for More Insights
Thank you for joining us on this insightful journey into the world of cryptocurrency! Understanding the dynamics of BTCUSDT and BTC.D can significantly enhance your trading strategy. Stay tuned for more market analysis and updates. Until next time, happy trading!
📊⚠️ Disclaimer
The information provided here is for educational purposes only and should not be taken as financial advice. Always conduct your own research and consult a licensed financial advisor before making any investment decisions. Trading cryptocurrencies involves significant risk and may not be suitable for all investors.

#ETH look for the false breakoutany false break out to the area of
2400-2500
will be a good buy sign with stop below 3200 and target 4300
trade safe and follow me 😉

ETH [ BEARISH SWEET ZONE]We are expecting a massive drop of ETH , however this T.A time frame view is 1D do not expect that it will play as early , it will take time ; rest assured that if you are going to put a position manage strictly your risk reward ratio ; it may play out but it will grab some Liquidities before it will play out

ETH THE UNLESS HAPPENS Hello Traders and everyone, I am Hadi Karaali, Known as SNIPERS_FX
If you like the idea, do not forget to support with a like and follow.
ETH THE UNLESS HAPPENS. 📚
👉As we mentioned previously in our analysis attached on the chart, price broke below our major swing low, and bears kick in for a new bearish correction movement.
👉Meanwhile, as the price will be approaching our lower previous major high, we will be looking for new longs, unless price managed to keep pushing downward till our lower massive demand zone.
Moreover, if the price managed to trade again higher, then we will be looking for new shorts for the next bearish movement. 📚
If you like this kind of analysis don't forget to like and follow
and as usual follow your trading plan and manage your risk.
Be patient and good luck!

ETHUSDT.1DIn this technical analysis of the Ethereum (ETH)/USDT daily chart on Binance, we are reviewing the primary technical indicators and price structures that might influence Ethereum's price movements in the near future.
Price Action and Support/Resistance Levels
The current price of ETH is approximately $3,042.48, showing a recent decline of about 1.93%. The chart identifies critical resistance (R1, R2, R3) and support levels (S1, S2, S3). The highest recent resistance is at $4,371.66, and support levels are situated at $3,293.19, $2,874.64, and $2,112.62. These levels are instrumental in determining potential turning points or consolidation zones in the market.
Technical Indicators
MACD (Moving Average Convergence Divergence): The MACD line below the signal line and a negative histogram suggest a bearish momentum is currently prevailing. The decreasing histogram height also indicates that the bearish momentum may be losing strength, which could mean a potential stabilization or reversal of the price movement soon.
RSI (Relative Strength Index): The RSI stands at approximately 55, indicating a neutral market condition. This level suggests that while the market is not in overbought or oversold territory, there is still room for either bullish or bearish developments depending on broader market cues.
Chart Patterns
The chart shows Ethereum in a descending channel pattern, indicating a potential continuation of the bearish trend if the upper boundary of the channel holds as resistance. The next key observation will be whether the price tests and respects the S1 support level, which could lead to a rebound towards R1.
Conclusion
Considering the present indicators and the price behavior within the descending channel, Ethereum appears to be navigating a bearish phase with the potential for testing further support levels, particularly if the current support at S1 fails to hold. The bearish MACD suggests caution, but the neutral RSI provides a slight buffer, indicating that not all bullish momentum is lost. Traders should watch for potential rebounds at major support levels or a break above the channel as signals for a trend reversal. As with any trading strategy in such volatile markets, setting stop losses and monitoring key resistance and support flips are advisable to manage risks effectively.
