What do Ethereum fans think ? TM : 1hHello dear traders. You can see two areas on the chart, you can enter the position depending on the sale and buy area. And I made a serious decision to share the important areas of my personal strategy for free if supported.
ETHUSDT trade ideas

ETH fighting against strong resistanceHello everyone, let's take a look at the ETH to USDT chart on a one-day time frame. As you can see, the price is currently bouncing off the downtrend line.
Let's start by determining the support line and as you can see, the first support in the near future is $3,530, then you can see support at $3,250, and then we have a strong support zone from $3,046 to $2,796
Now let's move on to determining the resistance points. And here we must start by identifying a very strong resistance zone from $3,821 to $4,110, only when we manage to break out and positively test this zone, we can see a move towards the resistance at $4,917.
Looking at the EMA Cross 50 and 200 indicator, they still indicate that the strong upward trend is maintained.
There is still room for growth on the RSI indicator, while the STOCH indicator shows a move towards the upper limit, so you should be careful and take into account a possible recovery.

ETHEREUM → The coin comes to life. Target 4,000?BINANCE:ETHUSDT is forging a retest of the key support area. On the background of NFP publication, the coin grows following the flagship - BTC and tests 3130. We are waiting for a retest of 3200.
An interesting promising candlestick pattern is forming on W1 on the background of the retest of the key support, which is the resistance of the previously broken ascending channel. The Chart clearly shows how the market is gathering liquidity at the expense of sellers, which is generally an encouraging pattern with the goal of further growth. On D1 it is worth paying attention to the triangle boundaries, as well as to the 3200 area, a breakout and subsequent consolidation above which will form a strong bullish potential that can continue to grow to the interim high of 4086, as well as to the ATH.
Support levels: 2900, 2812
Resistance levels: 3200, 3350
Technically and fundamentally, ETH has a good potential. The phase of realization of the accumulated energy can be activated at the breakout of 3200. Also, on a bullish trend symmetrical triangle is a good and potentially promising pattern.
Regards R. Linda!

ETH - wait for entry
I'm waiting for ETH to go a little bit lower to enter.
My plan is as in chart.
Disclaimer:
This analysis is based on my personnal views and is not a financial advice. Risk is under your control.

ETHUSDT, strong growth to 3882 and higher.Hi friends. Ethereum showing strong bullish signal. We have bears distribution at green zone. So my opinion growth to 3882 and maybe higher. Support me! 💪

#Eth Impulse drop to $3700Waiting on entry confirmation to short #eth.
Target is $3700 based on head and shoulder which also aligns with another confluence however I'll be looking to exit earlier at $3750 support.
I'll update when I enter(Likely 1:45 pm to -2pm). Anticipating an impulse quick drop...doesn't have to playout that way though
Short setup invalidated above $3900
Also. The head and shoulder is just 1 confluence that's easy to understand so thought I share. I mainly trade base on structure and key support and resistance areas, W volume, fibs , ema confirmations.
This not meant to be long term trade, just a corrective short down to daily support area.

Ethereum price performance analysis | 27.05The bullish reversal in the Ethereum price trend from the $2850 mark leads to a falling wedge breakout and completes a rounding bottom. With a neckline at the swing high of $4000, the altcoin is preparing for a breakout rally.
The bullish trend continues in ETH price with a 5% surge within 72 hours, potentially completing a triple white soldier pattern today. With buyers asserting dominance above $3900, the bull run chances above the $4000 psychological threshold increase significantly.
The bullish crossover in the MACD and signal lines reflects a minor pause as the histograms decline. Further, the daily RSI line turns flat near the overbought boundary, reflecting the minor consolidation below $3900.
As per the Fibonacci levels, the ETH price could aim for the $4698 level as the next target. Further, if any Ether ETF listing leaks this week, a bull run to the 1.618 Fibonacci level at $5841 is possible.
WHITEBIT:ETHUSDT

Golden Opportunity for Longing.Based on the historical market, the bitcoin halving event would followed with a significant price growth of the crypto assets, which matches the current market status. Thus, a bull market are expected in the next one and a half year.
As for the sentiment analysis, the current funding rate in bitcoin perpetual market are maintaining a slight negativity in the past 2 weeks, that indicate a stronger short bias in the general market. And the open interests drops up to 20~30% from its all time high, in which alt coin market drops even further, for instance open interest of dogecoin dramatically drops 60% up to todays date. Therefore, its treated as a cooling off of the bull hype in first quarter of 2024, which viable long opportunities are provided.
Above statement convey that a definite bull market are expected from now to the coming 2025, and current the market sentiment are expecting a strong short bias, which given a much higher liquidity for accumulation. Therefore technical analysis can be deploy to identify longs opportunity.
Technical specking, by using the vegas tunnel system in combined with a retracement type of price entries, the current mark prices of ETH is matching the condition for a high risk reward ratio and a high winning possibility trade. And a much wider growth space in compare to the bitcoin market.
Personal fund deployment will be 50% of my total fund in with a 2x leverage utilities. This is not a financial advice, trader should align with owns trading plan which present owns reponsibility.

ETHUSDT: Price is rose from $2800 to $3700, Wait for Correction!ETHUSDT, rose from our first entry at 2800$ to $3700, however, price rose rapidly and left gap. Which is why we think price will make strong correction and fill the area. We can expect the strong rebound from our area towards $4700.
**If you like our ideas then please like, comment and follow for more**
Team SetupsFX_

ETH Bullish Pennant | ETF approval confluence | Target: 2021 ATHNot Financial Advice
TL;DR Bullish Pennant on BINANCE:ETHUSDT daily chart, upwards breakout target would be very close to 2021 ATH. SEC approval of VanEck ETF (final deadline on May 23) could be a major catalyst.
A rare case of (potential) technical and fundamental confluence:
ETH has been building a Bullish Pennant since the end of the Feb 5 - Mar 12 rally
The retest of the multi-month support in place since October 2023 might signal that the bottom is in
The final deadline for SEC's approval of VanEck's ETH ETF lines up almost perfectly with the convergence between the pennant's resistance and the multi-month support
Interestingly enough, the target for an upwards breakout of the pennant around VanEck's approval deadline would be very close to the 2021 ATH

ETH/USDT 4HOUR CHART UYPDATE Hello friends, welcome to this ETH update from Crypto Sanders.
ETH/USDT Brief Update
Ethereum (ETH) is currently trading within a head and shoulders pattern on the 4-hour timeframe, as seen in the chart. Here are the key points:
ETH is showing a head and shoulders formation, which typically signals a potential bearish reversal.
Resistance and Support:
Around $3,950 to $4,000 (highlighted by the left and right shoulders).
Close to $3,640 (lower boundary of the pattern).
A breakout above the right shoulder (~$3,850) could lead to further gains.
A breakdown below the support level (~$3,640) would confirm the head and shoulders pattern, which signals a potential decline.
Monitor the $3,850 resistance level for signs of a breakout.
Keep an eye on a potential breakdown below $3,640 for bearish confirmation.
Stay tuned for further updates and analysis!
I have tried to bring the best possible results in this chart.
If you like it, hit the like button and share your charts in the comments section.
Thank you.

Ethereum Big pump is coming!Ethereum Big pump is coming!
open interest incresed by 20% which indicated big move on this coin
that's why i think big pump can happen
with our team we took a trade at $2980 area
I think price can rise toward $3300 - $3400 area

Lingrid | ETHUSDT in CONSOLIDATION phaseThe price perfectly fulfilled my previous idea. It hit the target level. BINANCE:ETHUSDT has broken out of its range zone and is now extending its upward momentum. As the market approaches the critical resistance level at $4000, it's trading slightly below this key area. A closer look at the price action reveals a double top formation, which could potentially lead to a pullback. If the price makes a fake breakout at support zone around 3550 - 3500, I believe it could set up for further upside movement. This is because the price has demonstrated strong bullish momentum, as evident from the series of higher lows and swing highs. Furthermore, the weekly timeframe shows a significant bullish candle, indicating market dominance and a strong upward trend. My goal is the resistance zone at 4000.
Traders, if yTraders, if you liked this idea or if you have your own opinion about it, write in the comments.

Ethereum - HOW to trade ETF approvalEthereum - HOW to trade ETF approval
I shared with you idea here to take LONG when price was below $3000
I think if they approve ETF - additional rise would happen
BUT
IF there would be NO ETF approval BIG SL HUNT happens)))

Is Ethereum bullish?📊 Due to the decrease in the downward momentum of the price movement, if the range of 3790 units is broken and the price stabilizes above it, the price may increase to the range of 3900 units 🎯 and in the case of the strength of the range of 4100 units🎯🎯.
📊 Otherwise, the price may fall to the range of 3350 units.

ETHUSD SHORT IDEARisk warning, disclaimer: the above is a personal market judgment based on published information and historical chart data on Tradingview, all analysis is only subjective. Hope investors consider, I am not responsible for your investment decision. Thank you.
Good luck!

ETHUSDT-Bullish Wave Coming Soon Detailed Analysis of #ETHUSDT
Time Frame: 1 Day (1D)
Overview
ETH/USDT has recently broken out of a falling wedge pattern, a bullish reversal pattern. This breakout indicates the potential for a substantial price increase, with an expected bullish move of up to 40% in the coming days.
Key Elements
Falling Wedge Pattern:
The falling wedge pattern is characterized by two converging trendlines that both slope downwards. This pattern forms when the price consolidates and the volatility decreases, indicating a potential reversal.
The breakout above the upper trendline of the wedge suggests the end of the previous downtrend and the beginning of a new upward trend.
Pattern Breakout Confirmation:
The breakout from the falling wedge has been confirmed, signaling a shift in market sentiment from bearish to bullish.
This breakout is a key indicator that the price is likely to increase as the market dynamics have shifted in favor of buyers.
Volume Analysis:
A significant increase in trading volume accompanying the breakout is often a key confirmation signal. It indicates that the breakout is supported by strong market participation and investor confidence in the new trend.
Sustained higher volumes post-breakout are crucial for the continuation of the uptrend and to validate the breakout.
Historical Price Behavior:
Analyzing historical instances of falling wedge breakouts in similar market conditions can provide insights into the potential price movement.
Historical analysis can help validate the anticipated magnitude of the price increase and the timeframe over which it might occur.
Market Sentiment and Fundamentals:
Broader market sentiment can significantly impact the price movement of ETH/USDT. Positive developments in the cryptocurrency market can bolster the bullish outlook.
Fundamental factors specific to Ethereum, such as network upgrades, increased adoption, and positive news, can act as catalysts for price increases.
Monitoring news and developments related to Ethereum is crucial for anticipating potential market reactions and understanding the drivers behind price movements.
Risk Management
Stop-Loss Orders:
Implementing stop-loss orders below the breakout point of the falling wedge can help protect against potential downside risk.
A recommended stop-loss level could be set at 5-10% below the breakout point to account for market volatility.
Position Sizing:
Ensure that your position size is consistent with your overall risk management strategy. Avoid over-leveraging and manage your exposure to maintain acceptable risk levels.
Proper position sizing helps mitigate the impact of potential losses on your overall portfolio.
Take-Profit Levels:
Establish take-profit orders at intervals that align with the anticipated 40% price increase.
Consider scaling out of the position incrementally to lock in profits and reduce the risk of market reversals.
Conclusion
The breakout from the falling wedge pattern in the daily timeframe for ETH/USDT suggests a bullish outlook with the potential for a 40% price increase in the coming days. This bullish expectation is supported by the confirmed pattern breakout and strong volume signals. Nonetheless, it is essential to remain adaptable to changing market conditions and employ robust risk management practices to protect investments.
Note: Cryptocurrency trading involves significant risks. Conduct thorough research and consider consulting with a financial advisor before making any trading decisions.

Ethereum (ETH): What Now After ETF Approval? Ethereum is back at a major resistance zone where we see big similarities with the Bitcoin ETF.
The price is still showing slow bullish signs near the major resistance zone, where there might be one last "push.".
We are now looking for a potential rejection to happen from that zone, which would result in a nice downward movement!! For now, all we can do is wait and keep monitoring!
Swallow Team

Chart Elements and Key Observations of $ETH.Price Levels:
Current Price: The current price of ETH is 3,817.20 USDT.
Support Levels: The chart shows two key support levels:
Around 3,795 USDT (marked by the blue dashed line).
Around 3,762 USDT (marked by a solid black line).
Resistance Levels:
Around 3,914 USDT (marked by a solid black line).
Trend Lines:
Downward Channel: The price is moving within a descending channel, indicated by two black downward sloping lines.
Volume:
Volume bars at the bottom of the chart show trading activity. Recently, volume appears relatively low, indicating possibly less trading interest or a consolidation phase.
Technical Indicators:
MACD (Moving Average Convergence Divergence):
The MACD line (blue) is crossing below the signal line (orange), which can be a bearish signal indicating downward momentum.
RSI (Relative Strength Index):
The RSI is at 46.40, which is close to neutral (50). RSI below 30 generally indicates an oversold condition, while RSI above 70 indicates an overbought condition. Currently, the RSI suggests neither overbought nor oversold conditions, but leaning slightly towards the lower end.
Potential Scenarios:
Bullish Scenario:
If the price breaks above the upper trend line of the descending channel, it could indicate a reversal of the downward trend, potentially targeting the resistance level at 3,914 USDT.
Bearish Scenario:
If the price fails to hold the support at 3,795 USDT and further at 3,762 USDT, it could lead to a further decline, with potential next support levels at or below 3,719 USDT.
Neutral/Consolidation:
The price could continue to trade within the descending channel, oscillating between the support and resistance lines, indicating a consolidation phase until a clear breakout (upwards or downwards) occurs.
Conclusion:
The chart shows that Ethereum is currently in a descending channel with important support and resistance levels identified. Monitoring the breakouts from the channel and the behavior at support levels can provide clues about the next price direction. The technical indicators suggest slight bearish momentum but are close to neutral, indicating indecision in the market.

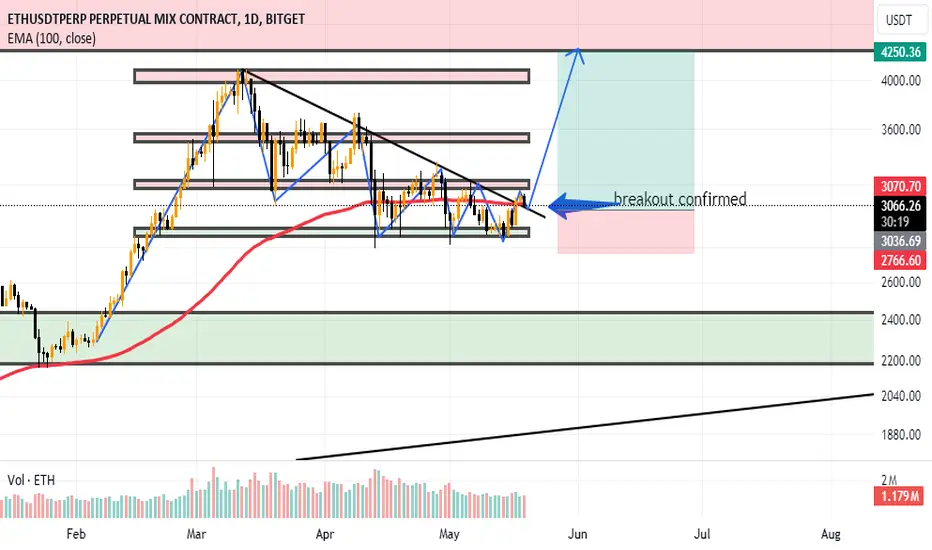
ETH Breakout confirmed on 4hETH 4h breakout confirmed market come to retest the trend line
lets take long entry
swing trade
entry :- 3060
take profit :-4050
stoploss:-2750
thanks me later
ETHUSDT is BullishIt seems that bulls have won the control of price action back from the bears as the price successfully printed a higher low, and is now ready to break previous higher high. A bullish rally is on the cards which could easily catapult price to 5k. Targets are mentioned on the chart.

ETHUSD Short IDEARisk warning, disclaimer: the above is a personal market judgment based on published information and historical chart data on Tradingview, all analysis is only subjective. Hope investors consider, I am not responsible for your investment decision. Thank you.
Good luck!

Ethereum Price Predications on the Daily timeframeEthereum (ETH) Price Analysis and Predictions for 2024
In this analysis, we explore Ethereum's current bullish trend, key support and resistance levels, and potential price targets. Using daily and weekly charts with indicators such as the 50 EMA, 200 EMA, RSI, and Stochastic RSI, we provide a detailed outlook on ETH's price movement. Watch for potential pullbacks to $2,900 support and aim for price targets at $4,046, $5,626, and $7,000. Join the discussion and share your thoughts on Ethereum's future!
