ETHUST trade ideas

Lingrid | ETHUSDT long from the SWAP zoneBINANCE:ETHUSDT broke through the range zone and made a new extension upwards. The market is trading above the swap zone. If price makes a fake break at support level and trendline, I think price may go up because price is gaining bullish momentum by updating swing highs and higher lows on the 1H timeframe. On the weekly timeframe, the market formed a long-tailed bar indicating the rejection of the rejection of the support level. My goal is the resistance zone at 3400.00
Traders, if you liked this idea or if you have your own opinion about it, write in the comments. I will be glad 👩💻

ETH buy setupDue to the slowing of the drop slope, and a bullish CH on the chart and the creation of liquidity pools at the top of the chart, as well as the presence of IFC movements, it is expected that if the green range is maintained, ETH will move towards the targets.
The targets are clear on the chart.
Closing a daily candle above the invalidation level will violate the analysis
For risk management, please don't forget stop loss and capital management
When we reach the first target, save some profit and then change the stop to entry
Comment if you have any questions
Thank You

Ethereum (ETH): Wyckoff Accumulation Pattern in Play
Ethereum (ETH) appears to be following the Wyckoff Accumulation pattern on the 4-hour timeframe. This pattern is characterized by several phases of price consolidation and distribution, followed by a decisive breakout.
The Wyckoff Phases:
Phase A (Accumulation): The price forms a trading range with multiple attempts to break out to the upside, but each attempt is met with selling pressure. This phase is characterized by low trading volume.
Phase B (Distribution): The price breaks out of the trading range to the upside, but the breakout is weak and quickly followed by a reversal. This phase is characterized by increased trading volume.
Phase C (Reaccumulation): The price returns to the trading range and consolidates again. This phase is characterized by lower trading volume than in Phase B.
Phase D (Mark-up): The price breaks out of the trading range with conviction and begins a sustained upward trend. This phase is characterized by high trading volume.
ETH's Current Position:
ETH has completed Phase A (Accumulation) and Phase B (Distribution) of the Wyckoff Accumulation pattern. The price recently broke out of the trading range to the upside but failed to hold the breakout and reversed back into the range. This suggests that ETH is currently in Phase C (Reaccumulation).
Expected Price Movement:
Based on the Wyckoff Accumulation pattern, I expect ETH to complete Phase C (Reaccumulation) by consolidating within the trading range for a period of time. This could be followed by a decisive breakout to the upside in Phase D (Mark-up), potentially leading to a significant price increase towards $4,500.
Additional Factors to Consider:
Overall market sentiment: The overall sentiment of the cryptocurrency market could impact ETH's price movement. If the market is bullish, ETH could break out sooner and with more momentum.
On-chain metrics: On-chain metrics such as active addresses and transaction volume can provide insights into the overall health of the ETH network. Positive on-chain metrics could support a bullish price movement.
Conclusion:
Ethereum's price action appears to be following the Wyckoff Accumulation pattern. While the pattern suggests a potential breakout to the upside, it is important to consider other factors such as overall market sentiment and on-chain metrics before making any investment decisions.

ETHUSDT potentially bearishI would like to see the ETH even lower. Indicators and the chart indicate a possible decline.
Now we are seeing a reaction to H1 BPR.

$ETH 15m time frame trade planWill consider quick long positions if the price reaches to my POIs. Will go in lower time frames to catch an entry model instead of jumping on a risk entry.

HelenP. I Ethereum will make retest and then continue growHi folks today I'm prepared for you Ethereum analytics. A not long time ago price reached a resistance level, which coincided with the resistance zone, and soon broke it, after which continued to move up. In a short time later, ETH rose to the trend line and then turned around, after which price started to decline near this line. Ethereum soon declined to the 3310 level, and later broke it, after which price in a short time declined to the support zone, which coincided with the support level. Soon, the price rebounded up from this zone, making a fake breakout of the 2930 level, but later it turned around and started to decline. A short time later, ETH fell to the 2930 level again and some time traded near, after which, the price turned around and made impulse up, breaking the trend line, and just now it continues to rise. For my mind, Ethereum will make a retest of the trend line, after breaking and then continue to move up to the 3310 resistance level, which is my target. If you like my analytics you may support me with your like/comment ❤️

Is there demand pressure in the market?📊Due to the strong upward momentum, the price will move upwards if the range of 3250 units is broken. and stabilization of the high price, the possibility of price increase up to the range of 3400 🎯and in case of strength, the range of 3500 units🎯🎯.
📊Otherwise, the price may fall to the range of 3100 units.

Etherem X Right prices: Etherem X Right prices:
We have enough data to connect the number's and pick some previous data to do the mid operation!
Currently ETH at Accumulation stage.
Area to watch for as market require a visit or may come back after the distribution stage:
Retest are uncompleted at this level: 3,009.82, $3,069.83, $3,110.24.
Next mis distribution price = $3,266.36, Follow by $3,280.32 . Careful the trap in the area of $3,009.82, $3,069.83, $3,110.24 as market will need to revisit that level so expect as low as this at some point! Unless we get a confirmation above the accumulation with a final retest the chances are still can go to this level.
Once the above are confirmed will be expecting the following prices:
$3,100.96
$3,300.58
$3,319.42
Mid Distribution price: $3,361.35 Follow by $3,385.93
Execution price: $3,451.66
Distribution for accumulation stage: $3,504.61.
Market will take a short break from here then we will continue towards the advance stage of the market.

ETH is Back | Trading above the POC | ETHUSDTETH is Back | Trading above the POC | ETHUSDT
Expecting trendline will be tested very soon..

Backtest 24/4 - Volume profile + delta + wave + trapHi
Backtest for improve my experience
combine Trap, wave + Volume profile + delta + tickvol
Most important are Market Structure & volume

ETH: 3.000 is important zone📊Analysis by AhmadArz:
🔍Entry: 3080
🛑Stop Loss: 3185
🎯Take Profit: 2986 -2859 -2736 -2622
🔗"Uncover new opportunities in the world of cryptocurrencies with AhmadArz.
💡Join us on TradingView and expand your investment knowledge with our five years of experience in financial markets."
🚀Please boost and💬 comment to share your thoughts with us!

Eth daily chartEth daily levels. This is done using an experimental method, this is not financial advice

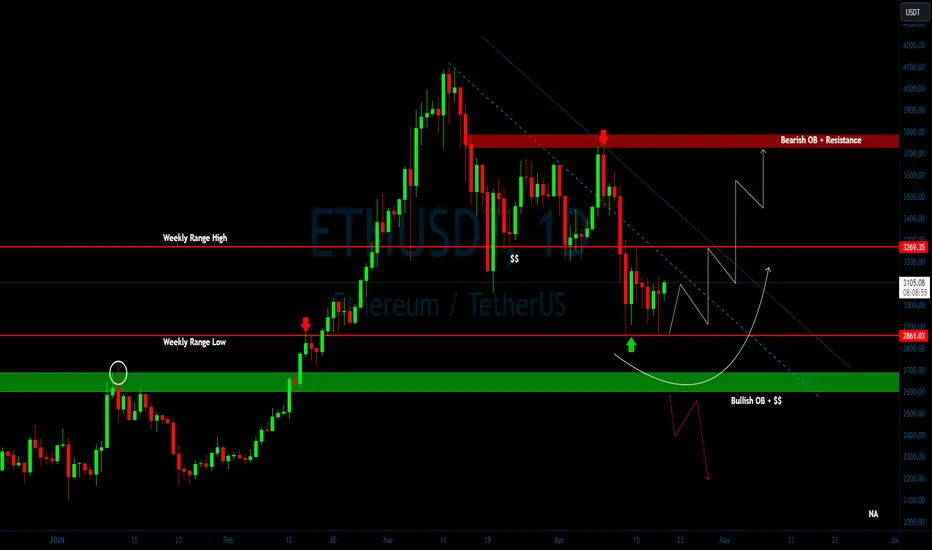
ETH/USDT presenting wonderful scenario? What Next👀💎 Paradisers, let’s explore the captivating movement of #ETHUSDT currently, it is raises probability of bullish continuation from the weekly low range at $2860.84. Although the price is trading above this range, this level remains crucial due to the presence of sound liquidity.
💎 Another intriguing scenario to consider is if #ETHEREUM fails to break the weekly low and drops below it. In such a case, our point of interest shifts to the lower bullish order block (OB) at $2606. There exists a high probability that the price will sustain momentum at this level and embark on a bullish move, potentially mitigating the impact of the bearish order block.
💎 Caution is advised, as CRYPTOCAP:ETH falling below this OB level could signal a shift toward a bearish trajectory. Stay vigilant and adapt to market movements! As always, remember to employ prudent trading strategies and implement proper stop-loss measures! Stay alert, monitor market movements, and eagerly anticipate further insights
MyCryptoParadise
iFeel the success🌴
Ethereum PredictionAs per the analysis on the chart.
The support for the down move would be 2220 and then 1100.
(2220 is mid-strong, 1100 is a very strong support. It's very likely any plummet stops at 1100)
The first resistance after the new ATH would be 7000.
(Hoever this resistance wouldn't be significant, considering the previous cycle)
If it hits 1100, in a weakened momentum, I would all in with my USDTs.
(Though depends on the down % of the other coins such as SOL or POL.
The greater the discount, the better.)
It might be the final chance to acquire an ETH in a thousand dollars anyways.

ETHEREUM - Price can break resistance line and continue to growHi guys, this is my overview for ETHUSDT, feel free to check it and write your feedback in comments👊
Recently price started to trades in flat, where it in a short time rose to resistance level, which coincided with resistance area.
Then price made little correction and soon backed up to resistance area, but later declined to bottom part of flat.
ETH made an upward impulse to resistance line, and soon turned around, after which made fake breakout of $3590 level.
After this, price in a short time declined to $2950 support level, which coincided with support area and started to trades near.
But recently ETH bounced up to resistance line and now I think price can little fall and then rise to $3300, breaking resistance line.
If this post is useful to you, you can support me with like/boost and advice in comments❤️

Few more days before entering ETH, BTC longIm currently trading on several main indicators like EMA 200 and Parabolic, support and resistence.
All signs seem to match that bull run is coming and after halving happened today, I'm waiting for 5-10 days to enter long on BTC and ETH.

$ETH bearish retest#ethereum #eth price may test the previous major support (currently the resistance), declination will be corrective. Not financial advice.

#ETH is holding the price above this 183 days long support!#ETH is currently staying above a support level that has held for 183 days, and the 100-day Simple Moving Average (SMA) is also acting as support.
As long as we remain above this support, things look positive for a potential bounce back up in price.
However, if the price falls below this level, we may see some corrections.
Keep an eye out for further updates.
DYOR, NFA
#Crypto CRYPTOCAP:ETH BINANCE:ETHUSDT BITSTAMP:ETHUSD

📊#ETH key inflection point, structural evolution ideas🧠➡️From a graphical structure point of view, the structure of ETH is very standard.
🧠If we continue to break through the turning point after the pullback, it means that the long structure is established, which means that we will most likely go higher from here.
⚠️Note that if it falls below the previous low, it means that we will continue the downward trend. If this scenario occurs, then when the price reaches the non-contradiction zone 2400-2500, you can buy directly, and both futures and spot can participate.
Trade safe✔️
🤜If you like my analysis, please like 💖and share it💬
💕 Follow me so you don't miss out on any signals and analyze 💯


ETH 19/04/2024Hi folks, I am following this price range for Ethereum. Overall, I am bullish unless we lose 2168. Price is at EQ level. Below the EQ level is our discount area and above is the premium. If we test old high+OTE, this can create a buying opportunity.

LONG #ETHUSDTLONG #ETHUSDT from $3 133.35
30m TF. The ETH asset has been moving inside the sidewall for several days, where from below we observe the withdrawal of liquidity for support, from which the price was squeezed to the horizontal resistance level on active purchases, showing the dominance of buyers with increased trading volumes.
Before entering the position, I will observe the continuation of accumulation below the level and the appearance of densities in the glass of orders before the breakdown.
