EURNOK-many signs for a pullbackThe big bias is bearish, but the price is touching a strong support now.
We have reason for a deeper pullback.
Weekly chart analysis:
On D1 details on the chart.
I prefer to enter now for a better R/R ratio
Greetings
Trade ideas

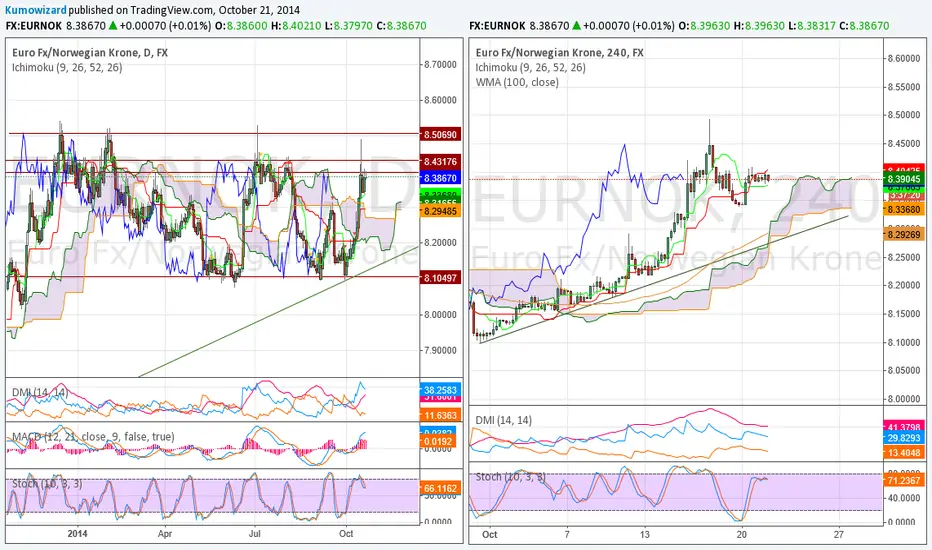
EURNOK - Looks good until 8,40-8,45, hold shortsWeekly:
- Short looks good until trades below Kijun Sen and Senkou B
- Heiken Ashi supports further bearish move
- weekly trend and horizontal support is between 8,40-8,45
Daily:
- Bearish Ichimoku setup, Tenkan and Senkou A lines pointing down.
- Heiken Ashi turns bearish again with haDelta back below SMA3 and zero line
- With next wave down watch Oscillator changing bias to bearish
- good chance first resistance ard 8,70 will be cleared in coming days
- next resistance (also our short term bearish tgt) is ard 8,45
Things that could support it fundamentally further: more correction in Oil (would be even better together with some USD correction) and more EUR weakness on back of ECB QE spreading to other crosses than only EURUSD.
Hold shorts! We'll talk about it again around 8,45.

EURNOK-last kiss from trendline and resistanceAfter a bullish rally the EURNOK has began a trend change.
It is not late to join this movement now.
Price is bouncing from a broken resistance, trendline and forming EW third wave.
Fundamentally, the NOK will recover soon from impact of low oil prices.
Happy trading.

EURNOK - NOK will be the new CHF!!!Norway is AAA rated, they have no debt at all, but they have huge cash reserves in their national funds.
The only "problem is" that they are Europe's oil producer country. But its a problem only until Oil starts a correction, or at least stops falling further. Otherwise what is the bigger problem? That Norway's income depends on oil, or if that ECB is ready to blow up the EUR through QE?
After SNB released the 1,2000 EURCHF peg, we have a black swan event today. Algos go crazy, mkts are fckd through all kind of CHF crosses. In terms of real economy CEE countries are fckd a bit too with their still existing CHF loans. I think regardless ECB decision, this black swan event may cause further turbulance in risky assets.
You have to find some safe haven, and as the USD bull is stretched already a bit, against the EUR I do not see a lot of other opportunites than CAD, or NOK.
Technical picture has not changed much since my last post (pls see link below), except a few things:
Daily:
- Chikou Span is hitting Price candles soon and can easily cross below at some point
- yesterday price action suggests there may be some serious strategic EURNOK long position unwinding. That would not be surprising, given the situation in Oil, where we there is an increasing chance for a 15 %+ correction (pls see on the other link below)
- Price is already below the level of Senkou Span B (future Kumo bottom line), still needs to clear the 9,00 key supp/resistance
4 Hrs:
- Price rejecting Kumo again. In fact it was trading a lot higher today during the crazy one hour after the SNB action, the real candle looks different from the one seen here on Tradingview. The spike top was 9,16, Price quickly bounced back down from there
- If Price clears 9,00, Chikou will make a strong bearish cross signal to confirm further price drop.
I think if investors start to look for new safe havens, while Oil pops up a bit, EURNOK will collapse as quickly as it was coming up.

EURNOK - Should it follow EURSEK?Well it may dip as well, but the situation for NOK is a lot harder than for SEK. The reason is simple: further drop in Oil Price. As Norway is Europe Oil prodicer country and its economy is really dependent on Oil prices, for EURNOK to be able to come lower, Oil Price should show some signs of correction from the heavily oversold levels.
Daily: Consolidation after the very extreme moves between 16-22/December. Tenkan and Kijun are a bit confusing as while Tenkan is below Kijun Sen, due to the one day spike Kijun still points up. Chikou Span is hitting Price candles as Price has been moving sideaway in a wide range of 9,00 - 9,21.
The Key levels is 9,00. It needs to break below to give sell signals and start moving lower towards 8,55-8,60.
As I said above, for the reversal to happen Oil should go corrective up and/or ECB has to deliver QE to weaken EUR
4 Hrs: The picture is neutral on 4 Hrs time frame. Very thin Kumo because of consolidation, all averages are flat (Senkou lines, Kijun, 100 WMA). Actually Price is attacking all flat lines together now from the top side with Slow Stoch Sell signal. Theoretically you can try a short here with stop above 9,20 / tgt at 8,98-9,00.

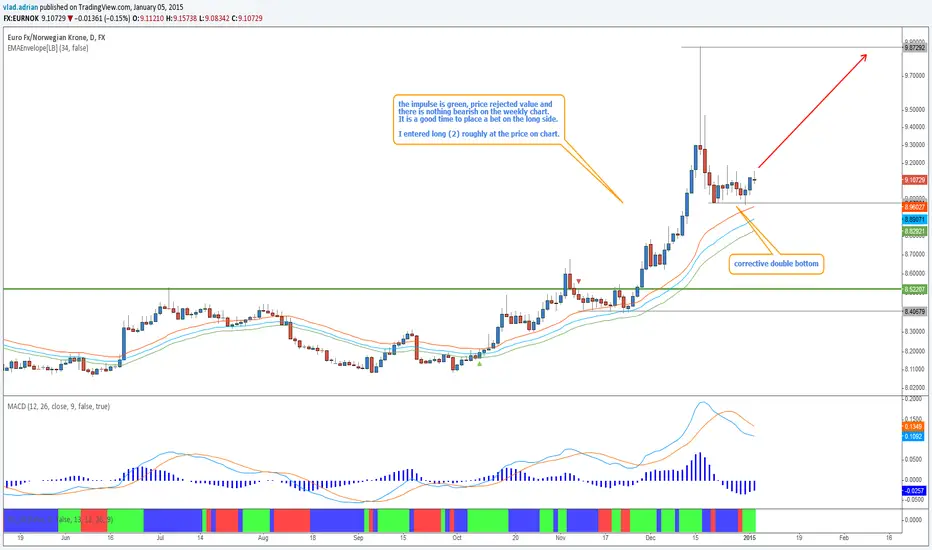
EURNOK - Corrective double bottomWeekly chart here
The impulse is green, price rejected value and there is nothing bearish on the weekly chart.
It is a good time to place a bet on the long side.
I entered long 2 roughly at the price on chart.
EURNOK after Norges Bank rate cutNorwegian krone sold off heavyly after Norges Bank decided to cut rates by 0,25% to 1,25%. It was fairly suprising move but weaker oil is weighing on Norwegian economy and it seems that the central bank does not want to take any unnecessary risks.
Most likely, the highs around 9.13 will not survive and we'll see at least a spike to take out some stops.
Capital Properties FX announces „The Santa Deal“
us3.campaign-archive2.com
Come and join us!

#EURNOK bear #crabWith Oil price consolidating a bit Norwegian Krona stopped falling. Since NOK is heavily exposed to Oil, any bullish Oil PA will push the NOK up. $Statoil being the Norwegian largest oil company has a share of over 22% in the Norway stock index OBX. OBX is declining, Statoil shares shows a little recovery, so being long on NOK makes sense from the fundamental standpoint.

EURNOK - Still has a chance to attempt a break lowerThis pair has been a bit tricky recently. In fact we can clearly see it is not trending at moment.
Daily: Pull back after the sharp spike, followed by a wider range top consolidation. In terms of Ichimoku it has becoming neutral as Future Kumo starts overshade Price and Chikou Span loosing open space, getting close to Price candles again. MACD is bearish, but DMI still bullish. I think we may see a few more days of "sideaway" moves before a clear directional move. Lower Key levels are 8,4250 and 8,3900. Upper key level is 8,5450.
As I think Oil is poised to a correction from recent selloff, EURNOK will likely behave as a proxy, and has chance to finally break lower. Btw in recent weeks all macro datas came out from Norway as better than expected, especially GDP and Mainland GDB prints yesterday. I still believe that NOK is the cheapest G10 ccy, and somehow I do not agree it should be the second worse performer this year after JPY. I mean c'mon, you can not even compare the two countries' performance and characteristics.
4 Hrs: Noise within the range. Price is still in the Kumo, what's more Tenkan and Kijun are in trhe Kumo too and ard same level as Senkou A and Senkou B. This all mean it is still absolutely neutral. Right now Price is crossing back below Kijun Sen and DMI is actualy turning to bearish again, but we still don't have a clear direction. As ROC indicators are still pointing down, I resold some this morning again at 8,48, but the real sell should hapen with a clear break below the 8,42-8,4250 key resistance area.
Stay focused as when the clear break happens, it will have an excellent risk reward to hold short position.

EURNOK - Watch for bearish accelerationSideaway below Kumo and 100 WMA. Next bearish sign would be a Chikou Span cross below Kumo.
Last candle refuses Kijun Sen again, andif closes lower, then it can be a bearish continuation signal.
8,43 should be cleared, then bearish momentum can acdelerate.

Possible HS-formation in EURNOKEURNOK has a possible HS-formation. Only a break and close below 8.40 will confirm this possible trade-idea. Resistance is around 8.50. Objective pricetarget if we get a break of 8.40 will be 8.15, while a stop loss should be executed if we close above 8.50.
Furthermore, we are currently testing the positive trend since last bottom at 8.10 (4H chart). Will be interesting upcoming days!

EURNOK - Sell after Kijun and Kumo retestNow we have a firming sell signal. After testing the Kijun Sen and the Kumo we have a nice bearish candle, and the trend may break finally. Tgt is 8,2950-8,3000
The other reason to put on this chart is to show some simple new script I placed on ROC indicator. Sometimes I find Slow Stoch less reliable and giving some false or confusing signals on the 4 Hrs time frame, so I try to replace it with this ROC combo. Upper panel is 71 period ROC vs its 76 period EMA, the lower panel is 91 period ROC vs its 58 period EMA.
Basic rule is that you can take trade signals in a direction when both ROC/EMA stays same way and you have a Tenkan/Kijun cross too. You can still decide wether you take weak Tenkan/Kijun signals, or if you wait for further confirmation or stronger signal, like a Kumo breakout. Still, if you had long, when ROCs crossed their EMAs and Tenkan crossed back below Kijun, it was a signal for decreasing momentum and to reduce/close bullish position.
The importance of the "zero" line is the same, when ROC is below the momentum is increasing bearish, when it is above, then increasing bullish.
This simple strategy is being tested, I hope it will give even better indication about momentum changes than Slow Stoch itself.
Don't forget, the main trading strategy will be still based on Ichimoku system.

Comeback for EURNOK?The NOK has depreciated rapidly in the past week on the back of weaker data and falling
oil prices. The market is now pricing in a roughly 50/50 chance of Norges Bank cutting
its policy rate at the December meeting. All things are possible, but this seems over the
top.
The NOK is much weaker than Norges Bank assumed in September and banks have
cut their mortgage rates. On the other hand, global interest rates have fallen and growth
has been slightly weaker than expected. On balance, though, Norges Bank would need to
revise down its growth projections for mainland GDP next year from 2.25% in September
towards 1% for current market expectations to be justified and we think that is really
pushing it.
With inflation close to target, house prices rising and unemployment largely
unchanged, it also seems unlikely that Norges Bank will be proactive and cut interest
rates in anticipation. The slide in the NOK therefore seems to be an overreaction.
Trading Idea:
Short on bounces up against 8.48-8.55 with a target price of 8,15. Stop loss if we close above 8.55 on weekly timeframe.

EURNOK - Is this the big "come back"?Despite all the very strong fundamentals, NOK has been beaten badly during last few weeks... just because some considered this pair as a perfect proxy for collapsing Oil. Well, despite Norway has its major income from Oil production and export, I don't think it was so reasonable to hit this ccy that much, while for example CAD was rather stable.
Weekly (right panel): What was very important for last week, to avoid a major horizontal break of 8,5450-8,5550 support area until weekend. EURNOK spiked at extreme 8,67, but within two days it dropped sharply back below the Key support, and resulted in a huge hanging man candle. From this we can expect a pull back down to the weekly Kumo, but until Price is above the cloud and the trendline (8,20 will be the most important level), the picture is still bullish biased.
Daily: Extreme moves, extreme ATR (volatility), which will likely stay high. MACD and Slow Stoch sell signals together, Price is just attacking the secunder bullish trendline and Kijun Sen. Whenever it manages to break, the move will continue down to next key level at 8,29.
4 Hrs: Price is about to break trend and Kumo, also DMI is giving a bearish signal. It will be a good counter trend short from now, but given the oversold Slow Stoch, first I'd really like to see the break, second I'd would wait for some pullbacks to 8,45+ leves to enter in case. As I said, volatility is very high, so adjust your trading size and stops accordingly.

EURNOK - Triple topThe weekly shows a very bearish formation at 8.5. The impulse is still green, but using the daily, I would say it's time to short
Now looking at the daily, it's time to play in anticipation. Look at the candle that formed two days ago, that kangaroo tail. It is very bearish. Looking back on the chart, the accuracy of candlesticks is not great, but considering where this kangaroo tail is, I believe a short bet should be taken.
I have closed my remaining position (entry in the linked chart section) and I have gone short, with a small position. I will add once the weekly impulse becomes blue.
As for targets, well I believe the least we'll see is 8.0. The question is if this pair can go below that. My trade plan is to keep adding to my short, and once we get close to 8.0, I will start taking profits, and leave maximum 50% on the table. If I will see a buying signal developing there, I will not hesitate to go long. If it breaks, I will consider adding back to my short.
Let's wait for 8.0!

EURNOK - Some pull back is possible from Key ResistanceI have been chasing EURNOK almost whole year, sometimes with more luck, sometimes with no luck. In fact it is trading in an extremely wide range.
Daily: Is it a similar pattern to the one seen in July? Spike to 8,50 area, but in closing the daily candle is a huge pinbar. Blow up followed by few days zig-zag, with bulls trying to force it up, then finally down massively again in the range (bulls' capitulation). I wonder if it will be the same this time or not. Anyway, I don't like this short NOK because of Oil is dropping idea. Then why CADNOK is still going up? Norway is the only real AAA rated country left. They have no debt at all, but has huge reserves.
Anyway Ichimoku is bullish now,maybe Slow Stoch is some indication for a possible pull back. But with major shorts we have to wait minimum until Kijun Sen picks up, like it did in August.
4 Hrs: Setup is still rather bullish, but Tenkan/Kijun made a weak bearish cross, Senkou B is flattenning out and Chikou Span hit Price wall. Slow Stoch has some negative divergence and is crossing down again. Price is in between Tenkan and Kijun. I think from this setup we can see a pull back to short term equilibrium, or to 100 WMA and the trendline, so to appr. 8,30-8,31.
If you check this 8,30-8,31 level on daily chart, that is/will be the level of Kijun Sen and Senkou B, so a retest there is not impossible. What happens nex, that we don't know. I will give you updates in time.
Trade idea: Sell 0,5 trade unit, stop at 8,4250-8,4300, or depending on your loss tolerance and money management strategy. Counter trend trade in larger position size is recommended only in case of a bearish Kumo breakout, or at break of 100 WMA and trendline.