SG waiting 15 before buyingClear setup on SG it will be interesting if the price reach 15$ without touching 56$ before, the potential upside move is big more than 300%
GLE trade ideas

Investment Opportunity SOCIETE GENERALEWe can observe a major wyckoff in place, the liquidity of previous all time lows was taken before initiating a massive upside move, the price is now consolidating on the market shift, creating another wyckoff in lower timeframe (Weekly/Monthly). I'm expecting the price to reach my demande zone (14.5$ to 18$ in grey) before initiating an upside move to reach 37$ first and then 55$ and even more.
Downside risk 20%
Upside profit 200% and more.

SOCIETE GENERALE STOCK.Monthly analysis.Hello ladies and gentleman,according my analysis To SOCIETE GENERALE STOCK .there is agreat probability long to 37 EUR or 44 EUR.

long position on GLEMy strtegy is based on price action with the reading of certain indicators that I like whilerespecting all the values that define the stock maket

today analysis the volume show us the end of trend and the chart may go down and after keep going up

SocGen (GLE.pa) bearish scenario:The technical figure Triangle can be found in the daily chart of the French company Société Générale S.A. (GLE.pa). Société Générale S.A., colloquially known in English as SocGen is a French-based multinational financial services company. Société Générale is France's third largest bank by total assets after BNP Paribas and Crédit Agricole. It is also the sixth largest bank in Europe and the world's eighteenth. It is considered a systemically important bank by the Financial Stability Board. The Triangle broke through the support line on 02/12/2022. If the price holds below this level, you can have a possible bearish price movement with a forecast for the next 14 days towards 21.785 EUR. Your stop-loss order, according to experts, should be placed at 24.400 EUR if you decide to enter this position.
Societe Generale SA agreed to merge large parts of its equities business with AllianceBernstein, intensifying the French bank’s bid to eclipse BNP Paribas SA in share trading. he Paris-based bank and AllianceBernstein will unite their cash equities trading and research units in a joint venture. SocGen will hold 51% and have the option in five years to buy the whole business, which will be run out of London under the Bernstein name.
The venture signals ambitions to take on BNP Paribas’ strengthened equities offer after the rival French bank took full control of its trading unit Exane and added businesses from retreating rivals.
Risk Disclosure: Trading Foreign Exchange (Forex) and Contracts of Difference (CFD's) carries a high level of risk. By registering and signing up, any client affirms their understanding of their own personal accountability for all transactions performed within their account and recognizes the risks associated with trading on such markets and on such sites. Furthermore, one understands that the company carries zero influence over transactions, markets, and trading signals, therefore, cannot be held liable nor guarantee any profits or losses.

GLE // cup handle formationAlthough there is a cup-handle formason on the chart, the targets are drawn according to Fibonacci. Let's look for closures where I indicated with X.

Selling GLE into trend of higher highs.Societe Generale - 30D expiry - We look to Sell at 25.79 (stop at 27.22)
25.89 has been pivotal.
The trend of higher highs is located at 25.80.
Preferred trade is to sell into rallies.
Daily signals are mildly bearish.
Our profit targets will be 22.22 and 21.22
Resistance: 23.00 / 24.00 / 25.00
Support: 22.00 / 21.00 / 20.00
Disclaimer – Saxo Bank Group.
Please be reminded – you alone are responsible for your trading – both gains and losses. There is a very high degree of risk involved in trading. The technical analysis , like any and all indicators, strategies, columns, articles and other features accessible on/though this site (including those from Signal Centre) are for informational purposes only and should not be construed as investment advice by you. Such technical analysis are believed to be obtained from sources believed to be reliable, but not warrant their respective completeness or accuracy, or warrant any results from the use of the information. Your use of the technical analysis , as would also your use of any and all mentioned indicators, strategies, columns, articles and all other features, is entirely at your own risk and it is your sole responsibility to evaluate the accuracy, completeness and usefulness (including suitability) of the information. You should assess the risk of any trade with your financial adviser and make your own independent decision(s) regarding any tradable products which may be the subject matter of the technical analysis or any of the said indicators, strategies, columns, articles and all other features.
Please also be reminded that if despite the above, any of the said technical analysis (or any of the said indicators, strategies, columns, articles and other features accessible on/through this site) is found to be advisory or a recommendation; and not merely informational in nature, the same is in any event provided with the intention of being for general circulation and availability only. As such it is not intended to and does not form part of any offer or recommendation directed at you specifically, or have any regard to the investment objectives, financial situation or needs of yourself or any other specific person. Before committing to a trade or investment therefore, please seek advice from a financial or other professional adviser regarding the suitability of the product for you and (where available) read the relevant product offer/description documents, including the risk disclosures. If you do not wish to seek such financial advice, please still exercise your mind and consider carefully whether the product is suitable for you because you alone remain responsible for your trading – both gains and losses.

Scocite Genraly FranceSSI Live Trading Series
Sun Storm Investment Trading Desk & NexGen Wealth Management Service Present's
Focus: Worldwide
By Sun Storm Investment Research & NexGen Wealth Management Service
A Profit & Solutions Strategy & Research
Trading | Investment | Stocks | ETF | Mutual Funds | Crypto | Bonds | Options | Dividend | Futures |
USA | Canada | UK | Germany | France | Italy | Rest of Europe | Mexico | India
Disclaimer: Sun Storm Investment and NexGen are not registered financial advisors, so please do your own research before trading & investing anything. This is information is for only research purposes not for actual trading & investing decision.
#debadipb #profitsolutions

GLE looking lower? Societe Generale
Short Term
We look to Sell at 22.24 (stop at 23.54)
Previous support level of 22.24 broken. Selling continued from the 50% pullback level of 26.20. The hourly chart technicals suggests further upside before the downtrend returns. The bias is still for lower levels and we look for any gains to be limited.
Our profit targets will be 17.19 and 16.10
Resistance: 22.25 / 24.00 / 26.00
Support: 20.50 / 17.15 / 14.00
Disclaimer – Saxo Bank Group. Please be reminded – you alone are responsible for your trading – both gains and losses. There is a very high degree of risk involved in trading. The technical analysis, like any and all indicators, strategies, columns, articles and other features accessible on/though this site (including those from Signal Centre) are for informational purposes only and should not be construed as investment advice by you. Such technical analysis are believed to be obtained from sources believed to be reliable, but not warrant their respective completeness or accuracy, or warrant any results from the use of the information. Your use of the technical analysis, as would also your use of any and all mentioned indicators, strategies, columns, articles and all other features, is entirely at your own risk and it is your sole responsibility to evaluate the accuracy, completeness and usefulness (including suitability) of the information. You should assess the risk of any trade with your financial adviser and make your own independent decision(s) regarding any tradable products which may be the subject matter of the technical analysis or any of the said indicators, strategies, columns, articles and all other features.
Please also be reminded that if despite the above, any of the said technical analysis (or any of the said indicators, strategies, columns, articles and other features accessible on/through this site) is found to be advisory or a recommendation; and not merely informational in nature, the same is in any event provided with the intention of being for general circulation and availability only. As such it is not intended to and does not form part of any offer or recommendation directed at you specifically, or have any regard to the investment objectives, financial situation or needs of yourself or any other specific person. Before committing to a trade or investment therefore, please seek advice from a financial or other professional adviser regarding the suitability of the product for you and (where available) read the relevant product offer/description documents, including the risk disclosures. If you do not wish to seek such financial advice, please still exercise your mind and consider carefully whether the product is suitable for you because you alone remain responsible for your trading – both gains and losses.

GLEHello guys
According to the chart you can see the price is moving downward trend and it has need more correction to have good R/r then we have permission to take short position until the target.
You should take signal at first then dont forget use stop loss and observe to your capital management.
Take a look on volume guys dont forget to check it, And dont forget to risk free and manage your position.
Everything is shown on chart, If you have question send us messages
Good Luck
Abtin

GLE SOCIETE GENERALEHello ladies and gentlemen,according to my graphic analysis of GLE SOCIETE GENERALE.
We notice that since February 18,2022,the GLE stock entered a downtrend until today,
approaching a strong resistance and support zone.
Now we have a golden opportunity te either buying or selling,with the stock approaching the golden point.
don´t forget to like and keep following guys.

SocGen (GLE.pa) bullish scenario:The technical figure Triangle can be found in the French company Société Générale S.A. (GLE.pa) at daily chart. Société Générale S.A., often nicknamed "SocGen", is a multinational investment bank and financial services company. The company is a universal bank and has divisions supporting French Networks, Global Transaction Banking, International Retail Banking, Financial Services, Corporate and Investment Banking, Private Banking, Asset Management and Securities Services. The Triangle has broken through the resistance line on 23/12/2021, if the price holds above this level you can have a possible bullish price movement with a forecast for the next 12 days towards 31.065 EUR. Your stop loss order according to experts should be placed at 27.770 EUR if you decide to enter this position.
The U.S. Department of Justice on Tuesday ended a criminal case against Societe Generale SA related to violations of U.S. sanctions, after the French bank agreed to pay $1.34 billion and met the terms of a three-year deferred prosecution agreement.
Risk Disclosure: Trading Foreign Exchange (Forex) and Contracts of Difference (CFD's) carries a high level of risk. By registering and signing up, any client affirms their understanding of their own personal accountability for all transactions performed within their account and recognizes the risks associated with trading on such markets and on such sites. Furthermore, one understands that the company carries zero influence over transactions, markets, and trading signals, therefore, cannot be held liable nor guarantee any profits or losses.

SocGen (GLE.pa) bullish scenarioThe technical figure Channel Down can be found in French company Societe Generale (GLE.pa) at daily chart. Société Générale S.A., often nicknamed "SocGen", is a French multinational investment bank and financial services company headquartered in Paris, France. The company is a universal bank and has divisions supporting French Networks, Global Transaction Banking, International Retail Banking, Financial Services, Corporate and Investment Banking, Private Banking, Asset Management and Securities Services. The Channel Down has broken through the resistance line on 27/07/2021, if the price holds above this level you can have a possible bullish price movement with a forecast for the next 11 days towards 25.815 EUR. Your stop loss order according to experts should be placed at 22.820 EUR if you decide to enter this position.
Risk Disclosure: Trading Foreign Exchange (Forex) and Contracts of Difference (CFD's) carries a high level of risk. By registering and signing up, any client affirms their understanding of their own personal accountability for all transactions performed within their account and recognizes the risks associated with trading on such markets and on such sites. Furthermore, one understands that the company carries zero influence over transactions, markets, and trading signals, therefore, cannot be held liable nor guarantee any profits or losses.

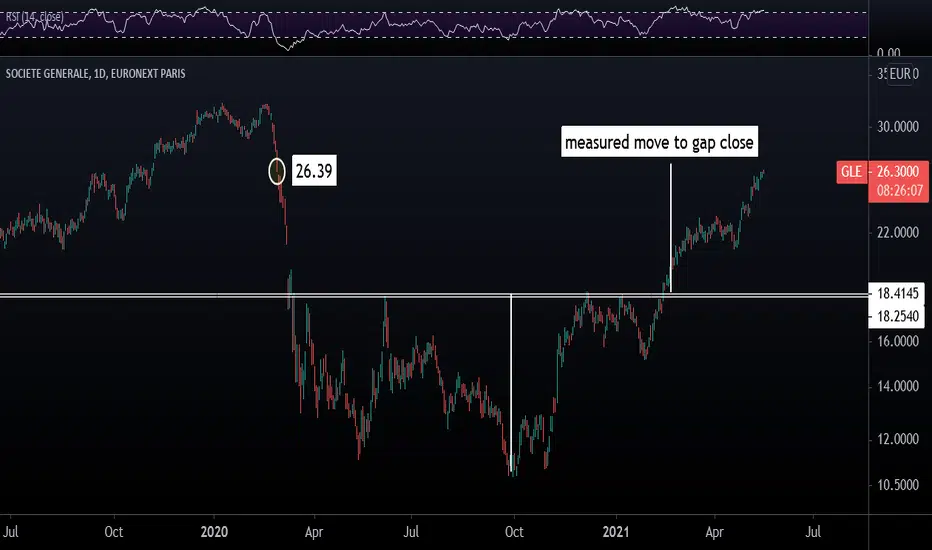
Societe Generale (GLE) - Full Target Reached - Close TradeToday, SocGen has reached my full target of 26.39, which is also the close of the gap. This trade can now be fully closed for a 39% return over a 3-month period.
Original Idea published to clients on 16-February-2021
Medium Term View | A strong, 11-month base breakout for the French Bank. The €18.25 to €18.40 level has acted as a supply zone throughout the period however, yesterday’s price action is positive following nearly 3 months below resistance. The measured upside move projects a target of €26.39 (TP 1), which is also where the price could close the the gap left on 27-February-2020. Stop-loss: 16.80.

ON THE VERGE OF BANKRUPTCY!FRANCE HAS THE HIGHEST DEBT LEVELS ON EARTH!
ITALY HAS ARGUABLY THE SLOWEST GROWTH ON EARTH ADJUSTED FOR INFLATION AND GOVERNMENT DEFICITS!
THEIR LARGEST BANKS REFLECT THIS! BOTH ARE APPROACHING THE KEY 5$ LIQUIDATION PRICE!
OF COURSE, IT IS FAR FROM RIDICULOUS TO SUGGEST THESE BANKS WILL NOT BE ALLOWED TO FAIL, AS THEY POSE SYSTEMIC RISK TO THE ENTIRE GLOBAL FINANCIAL SYSTEM!
IN FACT, THE ACTIONS OF THE EUROPEAN CENTRAL BANK DURING 2020, ALL UNDER THE GUISE OF "PANDEMIC RELIEF", WERE MOST LIKELY AIMED AT SUPPORTING THESE FAILING ENTITIES BY ALLOWING THEM TO OFFLOAD THEIR GARBAGE ASSETS!
THE REPO MARKET TROUBLES SEEN IN SEPTEMBER WERE LIKELY TIED TO A NUMBER OF BANKS, THESE 2 INCLUDED, FAILING TO RECEIVE OVERNIGHT LIQUIDITY DUE TO THE AWFUL QUALITY OF THEIR POSTED COLLATERAL!
THIS IS EXACTLY WHAT OCCURRED IN JAPAN, THE CENTRAL BANK SUPPORTED FINANCIAL ENTITIES WITH ZERO CHANCE OF EVERY BEING PROFITABLE, CREATING THE INFAMOUS "ZOMBIE COMPANIES"!
THEY CONTINUED TO OPERATE, BUT THEIR SHARE PRICES NEVER RECOVERED AS THEY ESSENTIALLY HAD NO PROFITS TO PAY OUT!
DO NOT BUY STOCK FROM SMART MONEY THAT SEES THE RISK AND IS EITHER SHORT SELLING OR JUMPING SHIP!

GLE: all hope is lostThere is not a single sign for optimism for GLE. All the MAs are heading down with 21EMA below 50SMA below 200SMA... Supertrend has been a sell for a while.
The last straw that broke the camel's back came last Friday, when it broke down the descending triangle on huge volume. The volume profile shows that there is thin resistance below. The decline is likely to accelerate.
Get out while you can.

Societe Generale SA (GLE) - Choppy or Bearish ? Societe Generale SA (GLE - France) is in ABC correction in 1 hr time frame as similar to CAC index, where B wave is over within wxy complex correction. Wait for impulse down to confirm the C wave down in 5 min time frame and its pull back to get in to trade with stops above invalidation level 15.76. In weekly time frame it is in downtrend, which may extend further.


Long term investors Opportunity!!We are on a all time low for Societe Generale at 14.5 and just below a major support never broke even in the middle of the 2008 crisis at 15.296 we should wait for the monthly close if it´s above or below 15.296 if above we will eventually rebond if not …
For the long term Investors the Dividend yield is 12.5% and the EPS (earning per share) = 3.085 you could add Societe Generale to your portfolio for the long term and keep buying on every low
