FETUSDT Dailyhey guys.
Double bottom pattern formed in PRZ zone. price is in channel and I guess it Range's circulation has just been finished base on Elliot waves Theory.
Reload your Sniper Rifle To hunt a Sophisticated Asset ;)
good luck
Masoud Eskandari
FETUSDT trade ideas

Inverse Head And Shoulder PossibilityThis could, of course, fail; but should be considered a viable possibility as well.

FETUSDT _ SHORTThis is just a setup but we need to see how the last wave comes up and what pattern it forms to enter the position.
Overally I'm looking for a wave g of diametric pattern to form so we could enter a nice short :)

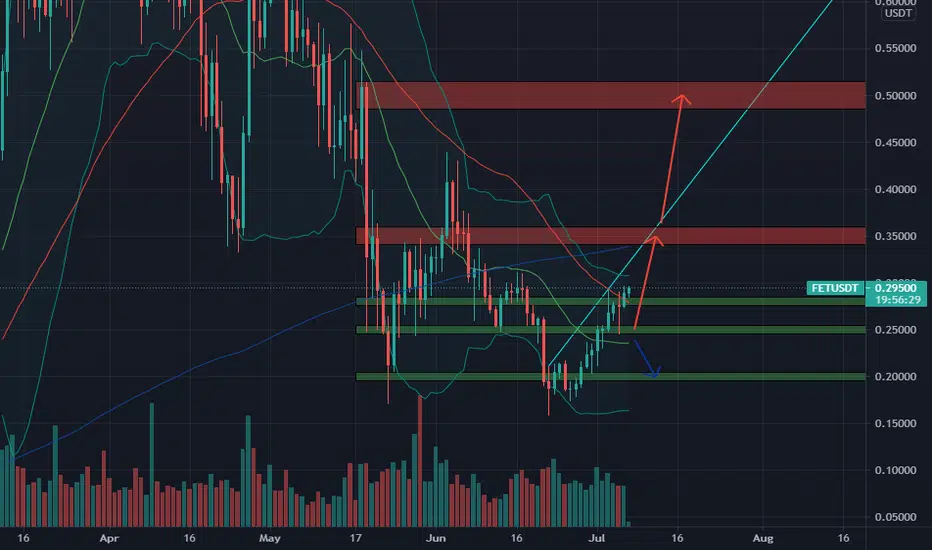
🆓Fetch.ai (FET) July-7 #FET $FETThe FET is heading towards the $0.35 zone, which is a strong resistance but I think the FET will rise sharply and quickly break through this zone to the $0.50 zone in the next few days. We will try to accumulate a lot of FETs in the 2 zones of $0.28 and $0.25. However, if the FET loses the $0.25 zone, the $0.2 zone is still very reliable to buy in
📈BUY
🔴Buy : 0.275-0.285$
🔴Buy : 0.245-0.255$. SL if B
📉SELL
🔴Sell : 0.34-0.36$. SL if A
🔴Sell : 0.485-0.515$. SL if A
♻️BACK-UP
🔵Sell : 0.245-0.255$ if B. SL if A
🔵Buy : 0.195-0.205$ if A. SL if B
❓Details
🕯Timeframe : 1 Day
📈Red Arrow : Main Direction as BUY and SELL section
📉Blue Arrow : Back-Up Direction as BACK-UP section
🟩Green zone : Support zone as BUY section
🟥Red zone : Resistance zone as SELL section
🅰️A : The Close price of candlestick is Above the zone
🅱️B : The Close price of candlestick is Below the zone

FetHi everyone , ok , I shared a chart in macro view about fet some days ago , but in short term view we can continue this view but with small targets in scale macro waves , fet broke out from resistance and now we are wait for retest of important resistance for take support , I determined best entry point for buy fet and either I determined short terms targets , I am expect green arrow roadmap for fet , good luck

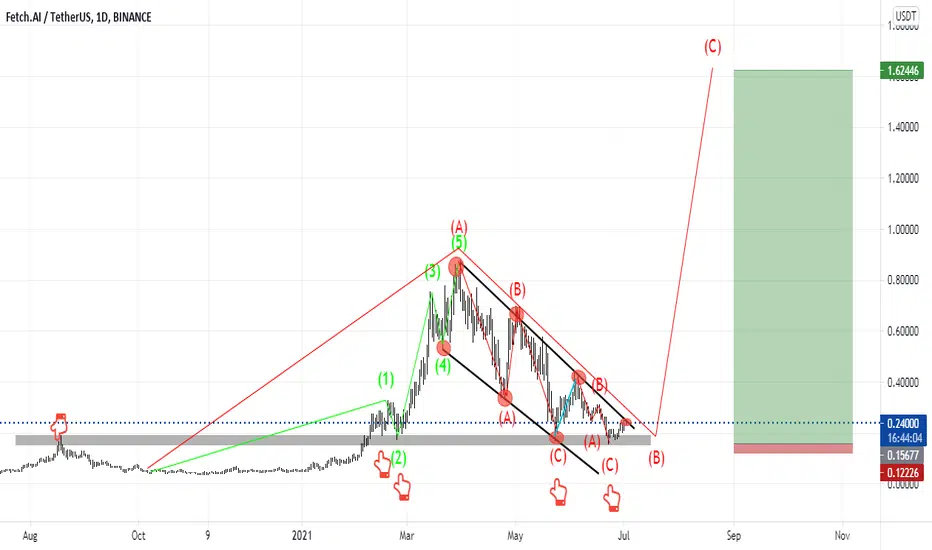
FET - Daily - "Minimum 0.50 cent target"Click Here🖱️ and scroll down👇 for the technicals, fundamentals and more behind this trade!!!
________________________________________________________
________________________________________________________
//////////////////////////////////////////////////////////////////
///////👍✋Not financial advice, do your own due diligence ✋👍////////
/////////////////////////////////////////////////////////////////
➡️Technical Standpoint⬅️
1.) Since our previous analysis, we correctly predicted the bag unloading area around the 0.60 range.
2.) Interesting enough, accumulation has been happening since 5/11/21. Minimum target is around 0.50 cents.
3.) If price holds above the 1.618 FIB, can expect a move up to 0.38 and 0.49 cent ranges.
➡️Fundamental Standpoint⬅️
1.) Mainnet upgrade scheduled for July 29, 2021. Only piece of news I find significant at this time.
➡️Current Season⬅️
- Bias in favor of Bulls. Currently BTC is building momentum at the current fear level.
//////////////////////////////////
//////Indicator Legacy/Meaning//////
//////////////////////////////////
✨ Linear Regression Line( LR ): is the green/red worm-like line.
✨ TD Sequential (TDS): tradetrekker.wordpress.com
✨ Social Activity Indicator(SA):
- Based on trader sentiment. The indicator will provide either a Strong Interest, Neutral/Some Interest, or No Interest signal.
- Lime background = spike in interest.
- Yellow background = drop in interest.
- Fuchsia Circles = Clustering of circles on the lower end of the spectrum means consolidation.
//////////////////////////////////
///🎉🎉🎉Before You Go🎉🎉🎉///
//////////////////////////////////
Leave a like👍 and/or comment💬.
We appreciate and value everyone's feedback.
""Keeping it short and sweet as always.""
- assetsandcoffee📈☕

Fet might be looking promising on higher time framesFET is close to breaking the descending triangle formed since the all time high. Wait for confirmation to get in or it will keep dropping.

FETfet rebound or die , it is at the first of third wave in macro view , good project for patience investors


FETCH AI: Is it intelligent to invest in AI right now?FETCH AI being a very deployable concept and useful token in the world of meme coins. It has seen its fair share of the pump in the month of March along with the crypto rally and came back on its average (well below it right now) in the crypto market crash of May. What is its status right now?
Exponential Moving Analysis And the Resistance Area
Looking at the exponential moving average in the 1hr chart, FET has been rejected at the 150 ema multiple times in the month of May. Right now, its near the end of a triangular mesh, where at the top is lurking both the three moving averages (50,100,150) at a very close range and the resistance slant line a little above the MAs which has rejected it twice recently and a couple of times during the downfall as well.
The Green Box:
The green box represents the support/resistance region. It is a middle ground between trends. FET pumped real hard on 26th April when it touched this area but now it failed to do so in both attempts.
CONCLUSION:
FETCH AI may have all the traits of the blockchain future one imagines but from an investment point of view, dark clouds are roaming over it. Will it be saved by rigorous marketing or an investment miracle because if not further dump seems inevitable.

Fetch.ai (FET) formed bit bullish Gartley for 220% moveHi dear friends, hope you are well, and welcome to the new update on Fetch.ai (FET).
On weekly time frame chart, price action of Fetch.ai (FET) has completed the final leg of Gartley pattern.

🆓Fetch.ai (FET) June-6 #FET $FETFET is retesting the 0.35$ zone after conquering it 4 days ago. But the recent 1D is very dangerous to FET so we only buy it if it conquers successfully this zone. Because if it fals at this 0.35$ zone, it may fall down to 0.25$ zone
📈BUY
- Buy : 0.34-0.36$ if A. SL if B
📉SELL
- Sell : 0.535-0.565$. SL if A
- Sell : 0.68-0.72$. SL if A
♻️BACK-UP
- Sell : 0.34-0.36$ if B. SL if A
- Buy : 0.24-0.26$ if A. SL if B
❓Details
🕯Timeframe : 1 Day
📈Red Arrow : Main Direction as BUY and SELL section
📉Blue Arrow : Back-Up Direction as BACK-UP section
🟩Green zone : Support zone as BUY section
🟥Red zone : Resistance zone as SELL section
🅰️A : The Close price of candlestick is Above the zone
🅱️B : The Close price of candlestick is Below the zone

FETUSDT is testing the daily resistance 🦐FETUSDT is testing the daily resistance and the descending trendline. IF the price will have a breakout from it, According to Plancton's strategy (check our Academy), we can set a nice order
–––––
Follow the Shrimp 🦐
Keep in mind.
🟣 Purple structure -> Monthly structure.
🔴 Red structure -> Weekly structure.
🔵 Blue structure -> Daily structure.
🟡 Yellow structure -> 4h structure.
⚫️ Black structure -> <4h structure.
Here is the Plancton0618 technical analysis, please comment below if you have any question.
The ENTRY in the market will be taken only if the condition of the Plancton0618 strategy will trigger.

