UK100GBP shorthi dear trader:all indices looking bearish but uk100 is the best shaping one ,therefore i decided to set an entry see what the out come will be.
UK100 trade ideas


FTSE 100 (UKX) | Best point for sell🎯Hello traders, FTSE 100 (UKX) in daily timeframe , this analysis has been prepared in daily timeframe but has been published for a better view in 2 day timeframe.
All of these counts correspond to a larger wave that may have preceded a correction or triangle.
Based on a count, we are in a zigzag motion, and from this zigzag, waves a and b are over, and now we are inside wave c.
Wave c itself is formed inside a channel or a triangle, and from this pattern, waves 1, 2, 3, and 4 are completed, and now we are inside wave 5.
Wave 5, like the other waves of wave c, was in the form of three waves, and of these three waves, the last wave did not end, and the end of this wave is confirmed when the red circle or trend line is broken.
We do not know the amount of correction at the moment, but it is possible to correct up to around 6550.
If the warning signal range is broken upwards, wave 5 is larger than wave 3, in which case we have to re-examine the waves.
🙏If you have an idea that helps me provide a better analysis, I will be happy to write in the comments🙏
❤️Please, support this idea with a like and comment!❤️

Shorting FTSE big timeHi
- if u are reading this u are witness to the beginning of what could be a legendary trade.
The chance of this to play out is about 20 pct.
- Atm im long dax and sp500 from the lows of 25th of January 2022.
But i shorted ftse today for to reasons:
1. Short setup confluences: Dobbelt top, failed auction of highs before covid, HTF inversive head and shoulders could be forming, and this is the right shoulder bout to form. - And we are having at daily pattern in dow jones that if friday is trading lower then monday the 14th of february would be to the short side as well..
2. For a Hedge.. I can not predict the future but only take the trade i know have a higher outcome for me to be on the right side - statically. I will close my longs in the us indicies, if we get a weekly close under this weeks close.

UKX SHORTHello traders, according to my graphical analysis of UKX , there is a high probability of a decline towards 5076 support level .
thank you for watching the analysis, it will be great when you support it with a like, follow me for more market analysis.

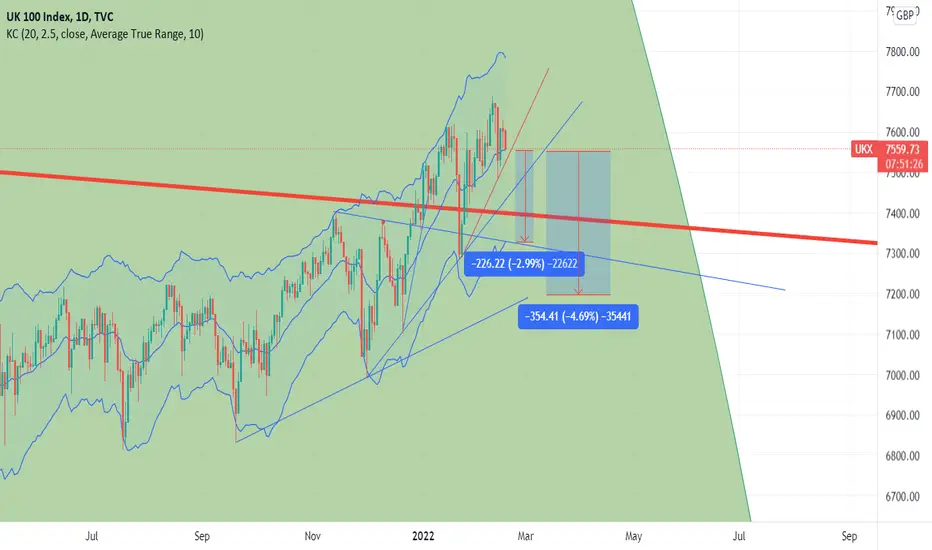
UK bearish divergenceWe went higher but RSI is losing momentum. It’s time for correction.
TP 7450-7200

Ichimoku:UK100 D1 Double roofIchimoku:UK100 D1 Double roof
if you like my strategy, please strictly control the single loss between 1-2%. We have played many games in the market. The investment itself is very low-risk, and irrationality is the biggest risk.
My trading behavior report is available at the link below.
I can analyze the market in a short time, involving foreign exchange, encrypted currency, commodities and stock indexes.
Quality needs your long-term follow-up verification.
Your support and comments are the driving force of my update! and Thank you

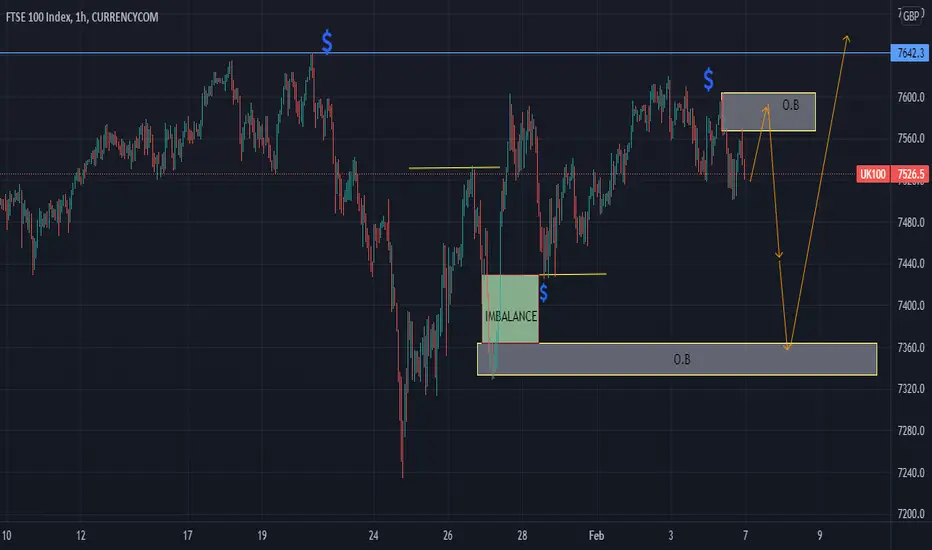
FTSE Continues strong but is this a double top or gap close?The FTSE continues on strong whilst other markets enter bear territory with the NAS and DAX trading below there D200. This is on the back of a shift away by retail investment as institutional investors outweighed retail investors significantly over the previous weeks. Reflecting on that dynamic I wonder if the there is enough leg in the FTSE to continue higher.
My Short term bias is for a trip back down the around the monthly 8ema level(7270) before a continuation. This has been a move seen in the past 4 out of 5 months with the 5th just narrowly missing the level. It has been this volatility which has been so profitable for me.
A bearish candle on friday and a close around the 8ema suggest the bears may be about to take control in the short term. I expect to see a close nearer the lower weekly extreme (7330) this week.
Trade safe

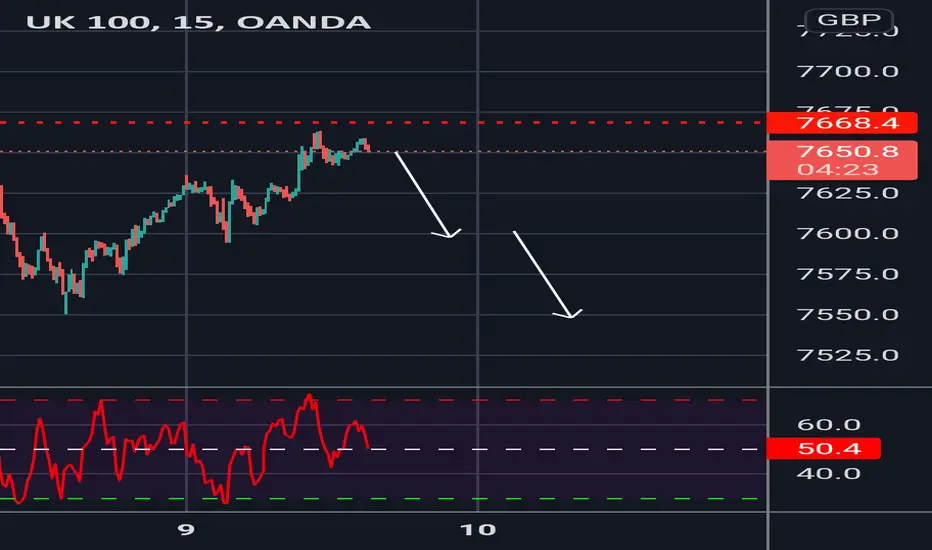
Uk100 GBP.... Ready to go down....Setup look like uk100 move lower ahead in month of Feb... Entry near 7525 area.. Stoploss above 7610.. and target 7200.. area..

FTSE 100 (UKX) | The best places to start a downtrend🔥Hello traders, FTSE 100 (UKX) in daily timeframe , this analysis has been prepared in daily timeframe but has been published for a better view in 2 day timeframe.
All of these counts correspond to a larger wave that may have preceded a correction or triangle.
Based on counting, we are in a zigzag motion, and from this zigzag, waves a and b are over, and now we are inside wave c.
Wave c itself is formed inside a channel or a triangle, and from this pattern, waves 1, 2, 3, and 4 are completed, and now we are inside wave 5.
Wave 5, like the other waves of wave c, is in the form of three waves, and of these three waves, the last wave does not end, and the end of this wave is confirmed when the red circle or trend line or the bottom of the channels is broken.
We do not know the amount of correction at the moment, but it is possible to correct up to around 6550.
If the warning signal range is broken upwards, wave 5 is larger than wave 3, in which case we have to re-examine the waves.
🙏If you have an idea that helps me provide a better analysis, I will be happy to write in the comments🙏
❤️Please, support this idea with a like and comment!❤️

ALL STOCKS ARE ABOUT TO CRASHHi All
I continue to watch the FTSE and all indices waiting for the second leg lower to take place.
I think the break above the ascending line was a false breakout, and with the bearish engulfing daily candle that printed a few days ago, as well as divergence against the RSI.
I think the FTSE will drop considerably over the coming months
I think a target in the end of 4500 is realistic
I'm going to wait to buy shares in things for a while yet.
lets see what happens
Duncan

UK1OO SELL BIASSimple but not easy, a SIMPLE TREND BREAK could see the price TEST the LOWS of JANUARY!
sHALoM


FTSE100 going up?I’m not a fan of FTSE. I don’t think is very exciting to trade but at the moment looks like the market will go up- if BoE won’t rise the rates tomorrow.
RSI, daily candle stick and MACD are bullish and I do believe there is enough momentum to reach new ATH - but wait for rate decision Thursday 12pm.

UK100 - complex correctionCrawling upside, looks like a corrective structure at this point.
Approx in the middle of the structure.

UK100 -- Bullish ProjectionsI like the Idea of bullish action on daily chart. We also have some nice bullish action on H4 which supports this. Let's see how it plays out!
Trading Idea --- NOT AN INVESTMENT OPPORTUNITY!

UK100A quick look at the FTSE100 Index using the traditional Ichimoku Cloud Settings of 9,26,52,26 and the MACD Indicator.
The Ichimoku Cloud Conversion Line (Tenkan Sen) is indicating that the Mid-Point of the Short-Term momentum is downwards at the moment.
The Ichimoku Cloud Base Line (Kijun Sen) is indicating the Mid-Point of the Mid-Term momentum is sideways at the moment but that may possibly change to downwards momentum once a significant low is created for the 26 periods.
The Ichimoku Cloud Lagging Span (Chikou Span) is indicating that momentum at the moment is downwards. Note that the Lagging Span (Chikou Span) is now under the Price from 26 Periods ago.
At the moment the Price is still in the Bullish Zone of the Ichimoku Cloud but is getting close to the Ichimoku Cloud Leading Span A (Senkou Span A) support level. At the moment of typing this, there is very little distance between the Leading Span A (Senkou Span A) and Leading Span B (Senkou Span B) support and resistance levels below the price.
Note that the Leading Span A (Senkou Span A) level is pointing downwards.
Note that the Last 5x Volume Bars have closed above its Volume 20 Period MA in the red.
The Price is still below its Volume Profile Fixed Range Point of Control (VPFR POC) for the Fixed Range of 8x 1hr candles that i have selected.
The Price is still way above its Volume Profile Visible Range Point of Control (VPVR POC) for this charts Visible Range.
If we look at the Moving Average Convergence Divergence (MACD), we can see that the MACD Line is still under is Signal Line and is indicating momentum is downwards at the moment. Note that the MACD Line as dropped under its 0.0 Base Line into the Negative Zone on this 1hr timeframe and that the Red Histograms are increasing in size. If you are waiting for confirmation to go long, you need the MACD Line to cross back ABOVE the Signal Line creating a Buy Signal for this 1hr timeframe.
Be on the lookout for a break below the Leading Span B (Senkou Span B) level into the Bearish Zone and a successfully re-test of the Leading Span B (Senkou Span B) level as Resistance, after that, full Bearish confirmation on this 1hr timeframe will be when the Leading Span A (Senkou Span A) crosses below the Leading Span B (Senkou Span B) creating a Kumo (Cloud) Twist into a new Bearish Red Cloud.
I hope this is helpful with trading.

FTSE 100 (UKX) | The best places to start a downtrend🔥Hello traders, FTSE 100 (UKX) in daily timeframe , this analysis has been prepared in daily timeframe but has been published for a better view in 2 day timeframe.
All of these counts correspond to a larger wave that may have preceded a correction or triangle.
Based on a count, you are in a zigzag motion, and from this zigzag , waves a and b are over, and now we are inside wave c.
Wave c itself is formed inside a channel or a triangle and from this pattern, waves 1, 2, 3 and 4 are completed and the instruments are inside wave 5.
Wave 5, like the other waves of wave c, is in the form of three waves, and of these three waves, the last wave does not end, and the end of this wave is confirmed when the red circle is broken.
We do not have an exact target for the correction rate at the moment, but it is possible to correct up to around 6550.
🙏If you have an idea that helps me provide a better analysis, I will be happy to write in the comments🙏
❤️Please, support this idea with a like and comment!❤️

How are stock markets across the globe interrelated ?Well, before we begin. Like the idea so I will have the will to update this idea regularly. '
The stock markets world over are related in one way or another, though cannot be said to be perfectly correlated with each other but have rub-off effects. Sometimes it leads to contagion effects across markets.
Let us see of the major reasons:
1. Most of the world economies depend one on another. US being the largest economy in the world, has most of the economies depend on its economy, in some way or another. Either, they export or import from US. Likewise, China has emerged as the largest trading nation on the world. China exports to major economies, likewise imports commodties and raw materials from large commodity based economies.
2. Currencies link world markets. USD being dominant currency in the world has another influence on the world markets. The dollar movements has profound influence on other markets.
3. Some of the companies are listed in more than one regional market. Say Toyoto. It is listed in Tokyo stock exchange. It is also listed in US stock exchange. So any price movement affecting the company, will have impact in all the dealings related to the stock in different markets.
4. Similar companies in the same industry can get simultaneously rerated or derated in different markets. Suppose investors in one country, value a particular company say Evergrande in one country at a particular multiple and rerated as a industry denominator, such valuations will have rub off effects across similar companies in the same industry across markets.
These are some of the reasons, by no means exhaustive, only suggestive that cause movements in correlated manner across various stock markets all over the world. As a result of this interrelation across the global markets I strongly believe FTSE 100 to follow the footsteps of US market, probably falling less, because it went up less since March crash compared to major US indexes.
Please keep in mind these are not financial advice by any means.
