20 September 2023 DAX SellI review my DAX sell, which I cut early as I thought it was too early and not meeting all my criteria.
I note that I did not do a video analysis on this before taking the sell; which is a rule break.
GER40 trade ideas

GER40 Shorts (Part 2 Retry)Extended SL to cover the Order block.
Second retry. Entering Shorts.
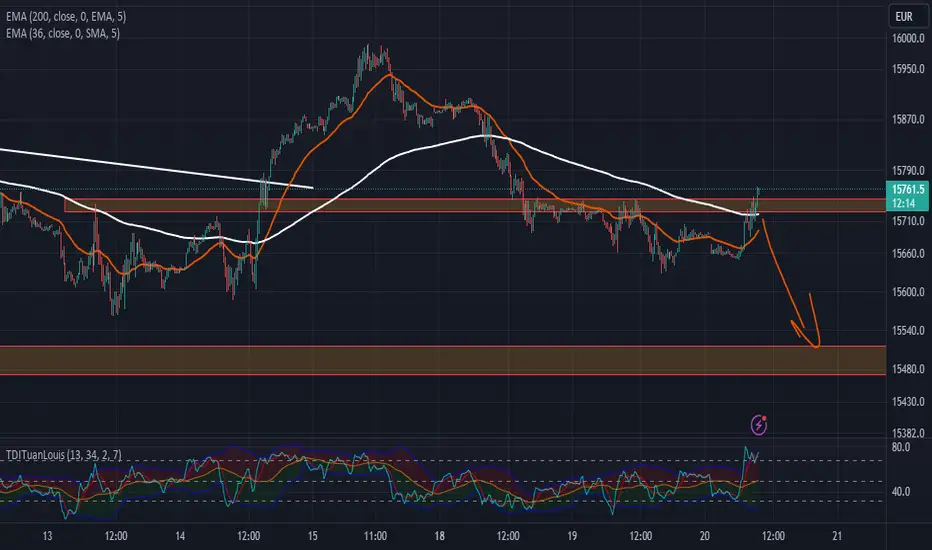
Lower high on H1, pushing against 200ema. Overextended pullback (78+RSI) and RSI divergence among peaks on M5.
We have swept liquidity and are now at the Order block zone.
Looking for shorts here once confirmation comes.
Ger40 Shorts
1. Downtrend pullback
2. RSI Divergence on recent swings on M5
3. Retest of resistance + previous retests
4. High RSI (75 on M15)
5. CONFIRMATION - Early entries now at low risk. Once bearish candle volume is confirmed, enter at full risk.
TRADING IDEA --- NOT AN INVESTMENT OPPORTUNITY

DAX Elliott Wave Analysis for Wednesday 20/09/2023The primary scenario (in green) is now calling for a triangle as a wave (X). We are still missing the E leg before we break down as a wave (Y). The secondary scenario (in red) assumes that wave (X) is in and that we can expect more downside as a wave (Y).

GER40 Can see price overall distributing on the HTF, however current price is accumulating. Looking to catch the buy up with LTF confirmation to set us up for a buy to sell swing situation !

DAX - Watch this mark!Hi Traders,
for the German Index DAX we clearly see a very important zone: 15.450
There are 2 possible Scenarios.
Scenario 1: He market accepts the support zone and we see a reversal. Then we can trade a pullback to 16.000.
Scenario 2: The Support will break. Then we expect sharp movement to 15.000 - following a pullback to the former support (which will then become resistance).
Next bigger support is for this case at 14.500
Right now the decision is open and we should also cleary watch the FED interest rate decision and conference tomorrow as German market often follows US indicies.
Wish you all great trades!
Team tegasFX

DAX Elliott Wave Analysis for Monday 19/09/2023The primary scenario (in green) is playing out and it looks like we finished wave (X). We can expect more downside as a wave (Y). The secondary scenario (in red) assumes more upside as a corrective wave B. That would mean we get an ABC flat correction instead of a WXY.

DAX: Pullback buy opportunity, very stable consolidation range.DAX formed a Bullish Cross between the 4H MA50 and MA100 but dropped sharply, the same kind of sell-off (proportionally) it had on the previous MA50-100 Bullish Cross (July 31st) which was a structured top. Opposite to theory, the Bearish Crosses have marked the bottoms.
In any case, the 1D technical outlook is neutral (RSI = 51.653, MACD = -44.700, ADX = 19.555) and that is largely due to the 0.236 - 0.786 Fibonacci range which has kept the index consolidating since almost the start of August.
Consequently any pull-back near the 0.236 Fibonacci would make an ideal buy entry. We will target a little under Fibonacci 0.786 (TP = 15,900).
## If you like our free content follow our profile to get more daily ideas. ##
## Comments and likes are greatly appreciated. ##

GER40Can see price accumulating, waiting for price to close above validating a MSOS, looking to enter to target the 4H Supply, once broken we can hold for a big upside move to set up big sells !

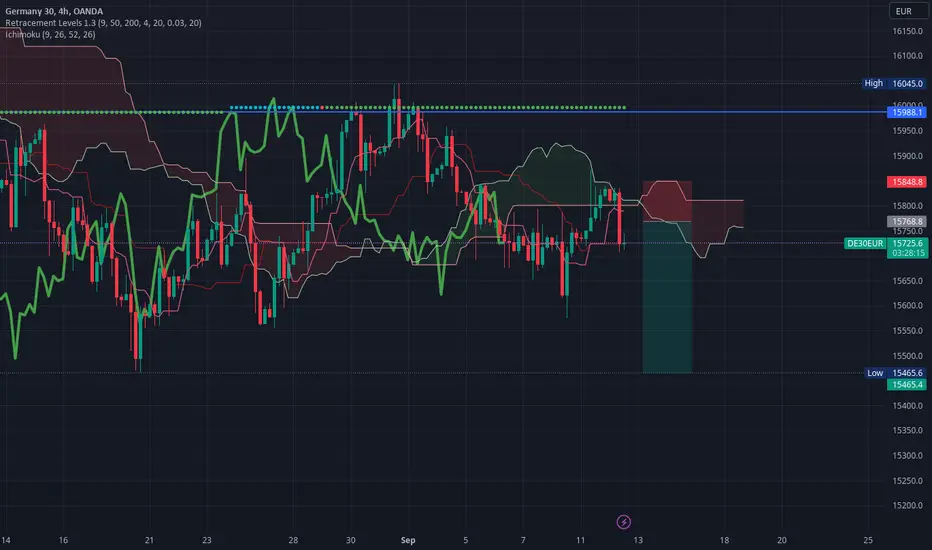
DE30EUR 18/09 MovePair : DE30EUR ( Germany 30 )
Description :
It has Completed the Impulsive Wave " 12345 " and Corrective Wave " AB " at Fibonacci Retracement Level - 38.20% and it has also Completed the Breakout and Retracement for the Corrective Pattern " Bearish Channel " in Short Time Frame

DAX to find buyers at previous swing high?GER40 - Intraday - We look to Buy at 15831 (stop at 15731)
Our short term bias remains positive.
There is no clear indication that the upward move is coming to an end.
Previous resistance level of 15830 broken.
Previous resistance at 15830 now becomes support.
20 4hour EMA is at 15830.
Preferred trade is to buy on dips.
Our profit targets will be 16081 and 16131
Resistance: 15900 / 15994 / 16045
Support: 15870 / 15830 / 15760
Risk Disclaimer
The trade ideas beyond this page are for informational purposes only and do not constitute investment advice or a solicitation to trade. This information is provided by Signal Centre, a third-party unaffiliated with OANDA, and is intended for general circulation only. OANDA does not guarantee the accuracy of this information and assumes no responsibilities for the information provided by the third party. The information does not take into account the specific investment objectives, financial situation, or particular needs of any particular person. You should take into account your specific investment objectives, financial situation, and particular needs before making a commitment to trade, including seeking advice from an independent financial adviser regarding the suitability of the investment, under a separate engagement, as you deem fit.
You accept that you assume all risks in independently viewing the contents and selecting a chosen strategy.
Where the research is distributed in Singapore to a person who is not an Accredited Investor, Expert Investor or an Institutional Investor, Oanda Asia Pacific Pte Ltd (“OAP“) accepts legal responsibility for the contents of the report to such persons only to the extent required by law. Singapore customers should contact OAP at 6579 8289 for matters arising from, or in connection with, the information/research distributed.

DAX Elliott Wave Analysis for Monday 18/09/2023The primary scenario (in green) is playing out and it looks like we finished wave (X). We can expect more downside as a wave (Y). The secondary scenario (in red) assumes more upside as a corrective wave B. That would mean we get an ABC flat correction instead of a WXY.

GERMANY 30 WITH POSSIBLE 540 BULLISH PIPSDE30 has been ranging for as long as time could tell ,
However, looking at the chart painted currently,
price is posed to rise to 16050 and above especially on a swing view

DAX bullish, all time high soonI can guarantee that Ger30 will climb to the top again, baisd on some candle I know , which I call hack or glitch
Good luck

DAX Index Is Forming This Decisive Ascending-Wedge-Formation!Hello,
Welcome to this analysis about the DAX Index in which we are looking at the 4-hour timeframe perspectives. In trading, it is always necessary to assess the market by a neutral perspective to come up with the most possible scenarios and move on with the opportunities resulting out of it rather than over-speculating the market into a one-sighted direction in which one does not have an exit plan and gets overwhelmed by circumstances when they show up. In this case, now I discovered a very interesting formation developing in the Dax Index and what are important factors, upcoming determinations, and aftermath-developments we should consider in this structure.
Structural Developments:
As when looking at my chart now we can watch there how the Index has emerged with this major ascending-wedge-formation in the structure marked in my chart with the black boundaries. Within this ascending-wedge the Index has the coherent wave-count with the waves A to E almost all already completed and now the index already showed up with an increased bearish pullback from the 15800 level in which it is testing and penetrating the lower boundary of the formation now again. Furthermore, it is necessary to register that the index moved below the 45-EMA marked in my chart in red which was previously support and is now a strong resistance by which a pullback is highly likely.
Upcoming Determinations:
Taking all these factors into the consideration the index is in a decisive situation now as when bearishness increases further in the near future this will lead to a breakout below the lower boundary and such a breakout, as it is marked in my chart, will complete the ascending-wedge-formation bearishly to the downside and the index will highly possibly move on with further bearishness to the downside. The final wedge-completion will activate the targets within the 14800 level marked in my chart in blue and when these targets are reached the situation needs to be elevated anew, it is also strong support therefore a stabilization in this structure has increased potential.
In this manner, thank you for watching my analysis about the DAX Index and the important decisive ascending-wedge-formation currently forming, great when you support it with a like and follow or comment, all the best!
"There are many roads to prosperity, but one must be taken."
Information provided is only educational and should not be used to take action in the markets.

Market Insights: Germany, Europe's only HopeRecent market movements in Germany and Shanghai have unveiled an intriguing confluence of factors worth exploring.
In Germany, the monthly market trends reveal a mixed narrative. While the indices have shown a bearish trend over the last few months, there are hints of optimism. The Tenkan-Sen remains above the Kijun-Sen, and the price is positioned above the Tenkan-Sen, traditionally regarded as bullish signals. The Senkou Span A hovers above Senkou Span B, and crucial indicators are above the Kumo Cloud, bolstering a potential bullish outlook.
However, this technical analysis should be considered alongside Germany's inflation data, which has shown signs of easing. While lower inflation often benefits equities, it may also reflect weakening demand and economic growth. This shift could influence central bank policies, bond yields, and currency dynamics, with varying implications for sectors.
On the other side of the globe, Shanghai has been marked by its own set of dynamics. Recent reports suggest a bullish sentiment, underpinned by a reversal in China's 10-year yield from three-year lows and proactive central bank measures.
While these developments paint an optimistic picture for Shanghai, it's crucial to remember that markets are complex and multifaceted. The interplay of technical indicators, economic fundamentals, and global conditions collectively shapes market trajectories. As investors, staying attuned to both Germany and Shanghai's evolving stories will be key to making informed decisions in the months ahead.

DAX reviewSame as Nasdaq, simple explanations to avoid confusion, please leave your comment if you have different ides

example for a short trend that continuesfair value gaps (FVGs) provide a clear low risk spot
but trailing the profit taking stop is also important
dont simly trust in the idea that the next target on daily
chart will be reached soon or later

DAX: Bearish BUTTERFLY DAX: Bearish BUTTERFLY - Beyond the technical aspect, we can see that the DAX will spark a huge bullish rally following Madame Lagarde's interest rate hike announcement. As far as I remember, interest rate increases rarely increase 1% at the same time. Today's excuses for "buying rising rates" include: “We buy because we feel the upward cycle is over, and this makes stakeholders happy.”
But no one brings up the fact that we didn't expect this raise. Because we had the same feeling at the previous ECB meeting - that there would be no more rate hikes - and today we share the same story and everyone believes it. There is something rotten in the merchant kingdom, and if they realize it, the sanctions will be terrible.

DAX 40 (H1): Possible rebound?!possible rebound on the PRZ zone
+MACD believe bullish
+Fibonacci
+EMA.50 and EMA.200
If you liked the idea, a boost or follow-up is always much appreciated.
Happy trading everyone.

DAX Elliott Wave Analysis for Friday 15/09/2023 (+ Higher TF)For traders (lower timeframe):
The primary scenario (in green) is playing out and it looks like we finished wave (X). We can expect more downside as a wave (Y). In our move down, we should first see some upside as a wave ((b)) or wave ((2)). The secondary scenario (in red) assumes more upside as a corrective wave B. That would mean we get an ABC flat correction instead of a WXY.
For investors (higher timeframe):
In the higher timeframe, the higher level wave ((1)) is probably finished. There is also an alternative scenario where we can make one more high to finish wave ((1)). This wave ((1)) should be followed by a wave ((2)) to the downside which is an interesting buying opportunity for investors. The wave ((2)) is currently unfolding as a WXY structure. Investors should buy the Y leg.

Central Bottom LineThe resent level has been the central line at which the index has found its bottom since March.
This means that we are trading within abroad range where we are close to the bottom now.
I expect this central line to hold again and the index to rise respectively.