Us100 Important Levels + Gann GridHello Dear Traders...
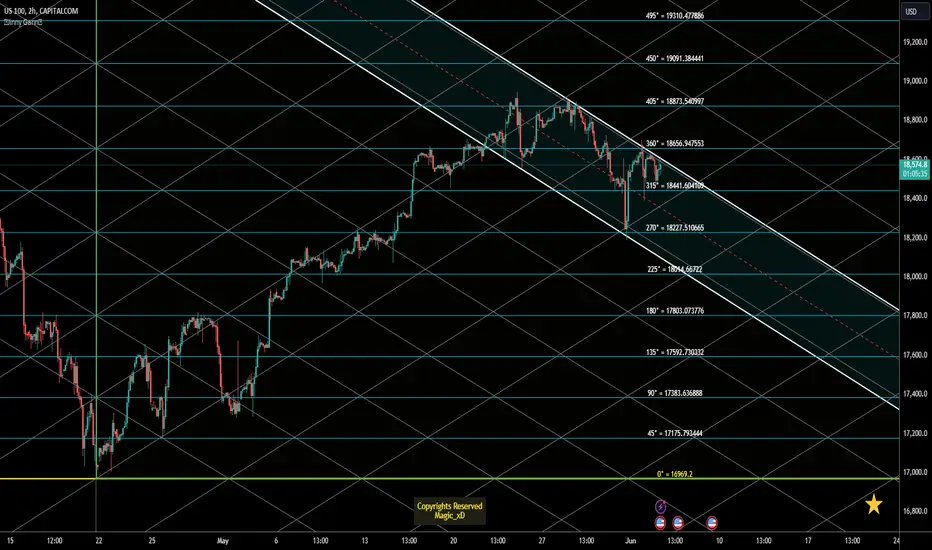
On the Chart Important levels for US100 Short term
Horizontal lines are Support/Resistance
Watch for Price action around these levels.
Also the Jinny Gann Grid, Giving you Expected Channels,Trends!
Wish you Best of Luck Trading
NDQ100 trade ideas
USNAS100 (4H)USNAS100
Tendency the price is under bearish pressure between 18,680 and 18,750
Turning level : The turning level between 18,680 and 18,750 so as long as the price below this level, there will be a bearish trend
resistance level : Breaking the turning level 18,750 , the price will up to 18,895
support level : The trading stabilizing below 18,680 the price will reach the support level of 18,431 and 18,234 , and under this level it will reach 18,120
corrective level : price will attempt between 18,680 and 18,750, correct itself before falling


NAS100USD: Potential Buy Opportunity for NY SessionGreetings, Traders!
Brief Description🖊️:
Currently, institutional order flow on US100 is bullish, therefore we are looking for price to take sell stops in order for a turtle soup trade condition (false break).
Things I Have Seen👀:
Bullish Institutional Order Flow📈: Anticipating price to continue to the upside after sell stops have been taken. Smart money will look to order pair (buy against the sell-side liquidity).
Potential Sell Stops🔄: Price may take sell stops before buying, presenting a turtle soup condition (false break of structure). After sell stops have been taken, I will look to take a confirmation entry.
Bullish Targets📉:
Daily FVG: The primary target.
M15 Bearish Order Block: The secondary objective, with an expectation to fill the liquidity void there.
What's Important Now❗
Stay observant for price action around these key levels to confirm bullish continuation.
Best Regards,
The_Architect

USNAS100 (More Bullish or Yet...)Technical Analysis
The price is expected to continue its bullish trend toward 18,735, having already stabilized in the bullish zone. The movement range will likely be between 18,550 and 18,820 until a breakout occurs.
Bullish Scenario: As long as the price remains above 18,600, it is likely to reach 18,735 and potentially 18,820.
Bearish Scenario: A stabilization below 18,550 would suggest a bearish trend, targeting 18,435 and 18,240.
Pivot Line: 18600
Resistance Levels: 18735, 18820, 18940
Support Levels: 18550, 18435, 18250
Today's range is expected to be between the support at 18230 and the resistance at 18820.

US100NASDAQ Poised for Continued Upswing, Eyeing 20,650 Range
In the current market landscape, NASDAQ appears primed for further ascent, targeting the 20,650 price range. Supported by robust momentum, the index is positioned to maintain its upward trajectory. Crucially, it is residing comfortably above both the exponential moving averages (EMAs) of 21 and 90 periods, indicating sustained bullish sentiment.
The NASDAQ's resilience is underpinned by several factors. Firstly, favorable economic indicators coupled with positive corporate earnings continue to bolster investor confidence. Additionally, ongoing fiscal stimulus measures and accommodative monetary policies provide further tailwinds to equity markets.
Furthermore, the index's ability to sustain levels above key EMAs, particularly the 21 and 90-day EMAs, underscores the strength of the prevailing bullish trend. This implies that the market sentiment remains buoyant, with investors exhibiting a propensity to buy on dips, further reinforcing the upward bias.
However, prudent risk management remains imperative, as market dynamics can swiftly evolve. While the current outlook suggests continued upward momentum, potential geopolitical tensions or unforeseen economic headwinds could introduce volatility.
In conclusion, NASDAQ's upward trajectory, targeting the 20,650 range, is supported by robust fundamentals and technical indicators, with the index comfortably positioned above key EMAs. Yet, vigilance and adaptability are essential amidst evolving market conditions.

NAS100 I Sentiment remains bullish I watch for these key areasWelcome back! Let me know your thoughts in the comments!
** NAS100 Analysis - Listen to video!
We recommend that you keep this pair on your watchlist and enter when the entry criteria of your strategy is met.
Please support this idea with a LIKE and COMMENT if you find it useful and Click "Follow" on our profile if you'd like these trade ideas delivered straight to your email in the future.
Thanks for your continued support!Welcome back! Let me know your thoughts in the comments!

Nas100 bears takeover Here's the possible senerios i like to see play out next week.
Bearish continuation: after a long run with the bulls the retrecement has been strong and we might see price drop lower to the 0,5 - 0.618 fib level there we can find order blocks and FVG
But lets see if price will respect the 1 hr order block above at level 18.624,00
If not the bulls might take over and will keep pushing price higher

CHART BREAKDOWN NASDAQ: Key Levels, Targets and Thoughts!Trade Update: NASDAQ
We have some great news on our recent NASDAQ trade! 💲
After analyzing the market conditions and identifying a solid setup, our trade has successfully Hit Take Profit 3 (TP3). This made sure that 100% of our positions have been secured and cashed out, allowing us to lock in ALL profits.
Following this, we closed this trade fully with a Risk to Reward of 10! This strategy not only protects our capital but also gives us the opportunity to capture further potential gains.
Stay tuned for more updates and happy trading! 🚀

history repeats itselfnas100 daily chart for educational use only,as we can see previously how price reacted after it broke a major level.creating higher highs and higher lows,it is expected for price to continue in that pattern

NAS100Hello guys happy new month
for the new month i am expecting prices to pullback at least to the 18000
Reasons :
1. Bullish Engulfing on the 1M timeframe
2.50% fib retracement at 18000
3.Trend line at 18000 psychological level

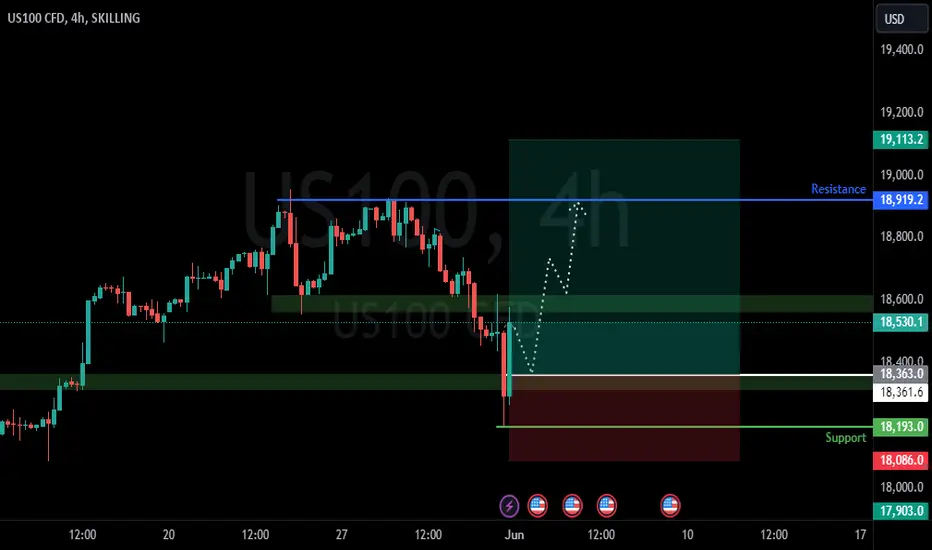
Nasdaq PlayBook SetUp IdeaExpecting price to drop at Sunday open 18,580 and then find support 18,500. From 18,500 on the 1 Hour Time Frame we can expect some buying pressure to 18,800. Cloning the bullish Move that started from 18,200 to 18,600 which was a 400 points move. We can now Project another Bullish move from 18,500 to 18,900 which happens to Hold some supply levels and also some liquidity.

NAS100 IDEA LONG POSITION THE NEXT WEEKhow did you do the analysis on nas100 ?
1/ general trenline frame daily : 4 hrs & 1 hr : uptrend
2/ determinie consolidation frame 1 hr & zone support and resistance
3/ the fundamontal anlysis positive

Today's analysis and strategies will help youHello traders,
Tendency the price is a short pressure in 19,590
Turning level : The turning level 19,590, so as long as the price above this level, there will be a new historical peaks
resistance level : braking turning level 19,590 , the price will rise to 19,715 and 19,890
support level : trading above turning level 19,590 , the price will reach the support level of 19,250 and 19,110 , stable this level reach to 18,935
corrective level : price will 19,590, correct itself before dropping
I will release insider signals every morning and evening, I hope it can help you, check out the ideas I release, I believe my ideas will add some value to your trading.

HTF NQnq htf nq htf nq htf nq htf nq htf nq htf nq htf nq htf nq htf nq htf nq htf nq htf nq htf nq htf nq htf nq htf nq htf nq htf nq htf nq htf nq htf nq htf nq htf nq htf nq htf nq htf nq htf nq htf nq htf nq htf nq htf nq htf nq htf nq htf nq htf nq htf nq htf nq htf nq htf nq htf nq htf nq htf nq htf nq htf nq htf nq htf nq htf nq htf nq htf nq htf nq htf nq htf nq htf nq htf nq htf nq htf nq htf nq htf nq htf nq htf nq htf nq htf nq htf nq htf nq htf nq htf nq htf nq htf nq htf nq htf nq htf nq htf nq htf nq htf nq htf nq htf nq htf nq htf nq htf nq htf nq htf nq htf nq htf nq htf nq htf nq htf nq htf nq htf nq htf nq htf nq htf nq htf nq htf nq htf nq htf nq htf nq htf nq htf nq htf nq htf nq htf nq htf nq htf nq htf nq htf nq htf nq htf nq htf nq htf nq htf nq htf nq htf nq htf nq htf nq htf nq htf nq htf nq htf nq htf nq htf nq htf nq htf nq htf nq htf nq htf nq htf nq htf nq htf nq htf nq htf nq htf nq htf nq htf nq htf nq htf nq htf nq htf nq htf nq htf nq htf nq htf nq htf nq htf nq htf nq htf nq htf nq htf nq htf nq htf nq htf nq htf nq htf nq htf nq htf nq htf nq htf nq htf nq htf nq htf nq htf nq htf nq htf nq htf nq htf nq htf nq htf nq htf nq htf nq htf nq htf nq htf nq htf nq htf nq htf nq htf nq htf nq htf nq htf nq htf nq htf nq htf nq htf nq htf nq htf nq htf nq htf nq htf nq htf nq htf nq htf nq htf nq htf

US100: Trend in 2H time framePlease pay special attention to the very accurate trends, colored levels and channel.
Do not forget about SL in each position.
Be careful
BEST
MT

still strongI just saw an article about fatidic viewpoints of experts of why this may not go higher. i didn't even read it but Im pretty certain that it was kiyosaky interview.. or one of those guys that constantly predict market crashes.
Still we are here, and ill publish as soon as i see somethin. This is still Flat to bullish, not the slight signal of weakness.

Nasdaq Longs We have an unmitigated order block below on Nasdaq 100, looking to long from there.
Reasons to buy :
Point of origin for the bullish movement.
Unmitigated order block.
Break of structure to the upside.

NAS100 BUY OR SELL STILL WAITING?Nas100 is still consolidating, moving in on direction playing around giving us choppy candlesticks which took out many traders out of the market who entered early trades and it gave us a W formation which however, we are waiting for a break and retest on the upside then we go for BUY enrties or SELL entries on the downside of our consolidation zone.

ExhaustedFor 1 1/2 year we are now rising but missing a necessary major correction. After this weeks long candle the begin of such a correction may be assumed. Often such candles indicate an exhaustion as they are driven by weak hands.

NASDAQ possible move Im expecting NAS100 to drop on our -OB Around NEW YORK SESSION because this area has been respected before in the past

SELL NASDAQThis will be our big trade of the day in which we target our 1H BISI.
Set your entry, SL and TP as sat on the chart!
For further questions don't hsitate to ask!
Follow for more!
