FTMUSDT trade ideas

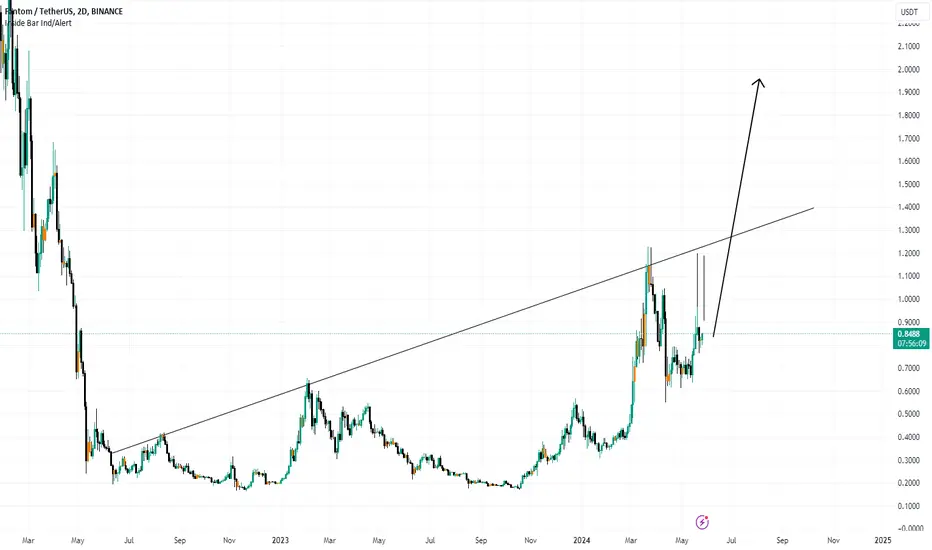
FTM: A massive move is coming! The price is at the apex of the triangle pattern, and a bigger move is coming! If you're looking to trade FTM at the moment, here's a quick setup that you might find helpful!
The idea is: Buy when the price breaks above 0.809$ and take profits at the levels shown in the chart.
Targets:
1. 0.828$
2. 0.85$
3. 0.87$
-------------------------------------------
About our trades:
Our success rate is notably high, with 10 out of 11 posted trade setups achieving at least their first target upon a breakout price breach (The most on TW!). Our TradingView page serves as a testament to this claim, and we invite you to verify it!

Strong uptrend, FTM I don't think It will give you a chance to buy in a big retracement.
It doesn't look like touch the low again and check the support(Yellow line)
so you can set buy on here and set a stop-loss appropriately.
Trend is so bullish that it will touch weekly resistance zone.
There is a difference from other altcoins.

FTM - ready to pump???Attractive FTM chart ready to move to the top of the channel
Are you ready????

FTM, the best undervalued cryptoLooking for 2 $ on the medium term but consider holding for long term 5-8$,
ready ? >:)
Bullish update on $FTMUPCOM:FTM still looking extremely bullish just like other Altcoins, if it holds the deviation below and breaks above resistance, the next target above will be our destination.

Chart Idea - FTMUSDT Swing LongBeautifully retraced to 618 fib level and now it's way to it's TPs. Please see the originally posted chart few weeks back

Chart Idea - FTMUSDT Swing LongFTMUSDT broke out from it's long bull flag. There are 3 confirmations which lead me to open this long trade.
Bounced
- from the 0.786 fib level
- from upward diagonal support
- from the diagonal support which was the resistance last year in Feb 2023
Entry: 0.76
TP: 1.95
SL: 0.618
It's a swing trade and could take weeks to play out. Will keep on updating on this thread.

just an IDEA !!!!!!In the zoomed-out view on the 1D and 4H charts, we are in an upward channel. On the 1D chart, we have already hit the middle line, which is acting as resistance. Same Within this channel in 4H, we were in a range area that we broke out of on the upside. I believe we have already hit the target of this range area, which is exactly at the middle line of the 1D uptrend channel. Now, based on the RSI and a small support line, I think it is possible to form a small head and shoulders pattern. If this pattern forms, we could follow its target to go back down, aligning with the Fibonacci retracement levels of 50-61.8%. This would bring us back to our support line, where we can then observe how the price reacts.

$FTM Bull Case - Multiple TargetsBINANCE:FTMUSDT is looking quite bullish, with a very clean chart and well respected Fibonacci retracement levels.
The support is sitting right at 61.8% of the last leg up. (Common reversal level)
I think the chart is open to multiple interpretations, each with a different target:
Descending Triangle : $1
Also a key psychological level and a previous resistance.
Bull Pennant : $1.15
Previous resistance and close to the top from last March.
Elliott Wave W3 : $1.3 or $1.62
If $0.76 is the local bottom, it would be a perfect Wave 2 end (61.8% of Wave 1).
According to Elliott Wave theory, the Wave 3 target would be either $1.3 (161.8% of W1) or $1.62 (261.8% of W1).
$1.3 is also a key support from 2021/2022.
$1.62 is also a resistance from 2022.
My strategy for this will be:
Open a long position after a break above the resistance trendline, with a wide SL
Take partial profits at each target
Starting from $1.15, move my SL up below the previous target
Not Financial Advice

Bullish update on $FETFET still looking extremely bullish just like other Altcoins, if it holds and breaks above resistance the next target above will be our destination.

FTM: Keep an eye on this level! If you're looking to trade FTM at the moment, here's a quick setup that you might find helpful!
The idea is: Buy when the price breaks above 0.734$ and take profits at the levels shown in the chart.
Targets:
1. 0.748$
2. 0.784$
3. 0.82$
-------------------------------------------
About our trades:
Our success rate is notably high, with 10 out of 11 posted trade setups achieving at least their first target upon a breakout price breach (The most on TW!). Our TradingView page serves as a testament to this claim, and we invite you to verify it!

Fantom (FTM) and Andre CronjeFTM's social and market activity is on the rise after Andre Cronje released an article highlighting the cash flow of FantomFDN in 2022
Fantom price today is $0.241135 with a 24 hour trading volume of 230 million dollar. FTM price is up 12% in the last 24 hours
Andre Cronje, a long serving figure in the DeFi space, says the Fantom blockchain project he advises is cash-flow positive, earning more than $10 million in annual revenue
Cronje shared a blog post on Monday that claims the Fantom team maintains more than $300 million in assets without specifying how much is considered liquid. “We are still scaling up,” Cronje said
Fantom’s reported treasury, as yet unproven on-chain, is made up of around 450 million FTM ($85.7 million). There’s also $100 million in stablecoins and $100 million in undisclosed cryptocurrencies, as well as $50 million in non crypto assets, per Cronje’s post.Fantom is a layer1 blockchain compatible with Ethereum Virtual Machine. The network competes with the likes of Solana, Avalanche and Polygon for Ethereum’s market dominance. but lets talk about the technical analysis
the blue line shows the important resistance (0.29$) for Ftm and if bulls breaking it, the next targets will be 0.31 - 0.4 and
if you managed to long at 0.17 its time to take some profit as well

I am Long on FTM 4HTFFTM looking good for long lets see, i am wrong or right
targets and entry are mentioned

Fantom (FTM): Bullish Setup with Strong Support Levels!Looking at Fantom on the daily timeframe, we see a promising setup following the completion of Waves 3 and 4. Wave 4 ended around $0.567, and since then, we have observed a consistent formation of higher lows. This pattern suggests a continuation of the upward trend.
The recent rise has left behind a breakout gap. Our plan is to see this gap touched or closed, and subsequently, we aim to use the underlying demand zone for Dollar-Cost Averaging (DCA) if further pullbacks occur. Within this area, we have two significant supports: the Point of Control (POC) and the High-Volume Node Edge. These levels should provide enough support to prevent the price from falling below this range.
Our target is set at a minimum of $1.22, though it could go higher, considering this is likely Wave 5. This target aligns with the expected continuation of the bullish trend as indicated by the Elliott Wave theory.
It is relatively easy to see that there are many liquidation levels above the current price for FTM. Significant liquidations have already been taken out, particularly just shortly after the ETF approval when many overleveraged positions were liquidated. Currently, there aren't many liquidation levels below the current price.
Therefore, we believe this might be a good time to dip again to clear out any remaining liquidation levels. After that, we expect to absorb the remaining short positions and push upwards. There is significant room to move higher, reaching our first target and potentially taking out more liquidations along the way.
Focusing on Fantom (FTM) on the quarterly VWAP chart, the 2024 Q1 VWAP has acted as a significant resistance level, respected four times. This consistent resistance often becomes a powerful support once broken, marking the start of a bullish phase. We anticipate the 2024 Q1 VWAP will transition from resistance to support, signaling strength and potential upward momentum. Additionally, the 2024 Q2 VWAP is providing strong support, reinforcing our bullish outlook and underpinning the price action.
With the combined support from the 2024 Q2 VWAP and the potential flip of the 2024 Q1 VWAP, Fantom is poised to gain momentum. We expect this to drive the price upward, leading to a retest of the 2024 Q1 VWAP soon. In summary, the interaction between these VWAP levels is pivotal. The 2024 Q1 VWAP is likely to become new support, bolstered by the 2024 Q2 VWAP. This setup suggests Fantom could move higher in the near future, retesting and possibly surpassing previous resistance levels.
We also need to consider the monthly VWAP chart for Fantom (FTM). Resistance was encountered between $0.915 and $0.925, defined by the Previous Monthly VAH and the March VWAP.
Currently, the May VWAP is holding, along with the Previous Monthly VWAP. However, we might fall below this level, where the Previous Monthly VAHL and May VAL should provide support. This alignment offers solid support and aligns with market structure and Elliott Wave principles.
Maintaining these levels is crucial for sustaining the bullish outlook and allowing the market to stabilize before moving higher. Holding the May VWAP and the Previous Monthly VWAP shows Fantom's resilience, potentially facilitating upward movement. If a dip occurs, support at the Previous Monthly VAL and May VAL should stabilize the price and provide a foundation for the next bullish phase.

SOL and FTM recent strong runners getting shortterm weaknessFTM recent strongest now still no action and a weak bounce for a potential 12h bearflag,
SOL same story as FTM. looks like recent runners lost attention and will only be back in play at a backtest of 2 D eq breakout range in 4h OS !

Just an IDEA ( FTM 1D )I think we are not in a good situation right now, and we need to follow this trendline. Since the EMA 200 daily is under this trendline, it is very important.
We could hope that if we lose the trendline, We might go down with a shadow, touch the EMA 200, and then go back above the trendline again. Meanwhile, 0.55 is still a good level to consider.
Bullish Scenario:
If FTM can maintain above the trendline and the EMA 200, we might see a rebound towards the resistance levels at 0.8132 and potentially 1.0348.
A break above 1.0348 could signal a stronger upward movement.
Bearish Scenario:
If FTM breaks below the trendline and fails to hold the EMA 200 support, we could see a drop towards the 0.55 support level.
The worst-case scenario THAT I DONT WANT TO Consider YET , is that we could see FTM dropping to around 0.42-0.43.
let me know what you think please

FTMUSDT Wait to buy or buy now - ready for a big jumpFTM is good to buy now for a bigger wave in bigger timeframe.
In the small timeframe, it could jump up to 0.84-0.86.
Then it will make a correction to 0.7 to complete full ABC.
After that, following Down theory, it will make another wave up to 1.5

FTM USDTFTM logo on the price channel looks exactly like the FET currency and has a positive rise in halving.
Buying areas marked in orange, or buy in stages, and it is not necessary for the currency to reach exactly the box specified below

$FTM continuation to the upside Simple idea, simple execution imo.
With the recent $10 million investment from renowned backers, my confidence in UPCOM:FTM has only grown stronger.
This significant injection of capital underscores the immense potential of UPCOM:FTM and the trust that influential investors have in its future.

Analysis for FTM (Fantom USDT) for Next MonthHistorical Performance: Fantom USDT (FTM) has shown significant growth over the past three months, with a steady increase in its market value. This positive momentum could indicate potential for further growth in the future.Resistance Levels: The coin has faced resistance at various price levels, with the most significant being around the $0.80 to $0.85 range. These levels may act as psychological price barriers, but they could also be potential breakout points if the price action surpasses them.Support Levels: FTM has found support at price levels between $0.60 and $0.65. These levels have been strong, with the price bouncing back up after touching them, which suggests strong buying interest and potential for future growth.Technical Indicators:Moving Averages: The coin is currently trading above its short-term and medium-term moving averages, which could indicate a bullish trend. However, it is also important to monitor its performance relative to its long-term moving average.Relative Strength Index (RSI): The RSI is near the midpoint at around 50, which suggests that the coin is neither overbought nor oversold. This could indicate potential for further price movement in either direction.Market Sentiment: The overall market sentiment for FTM has been positive, with a steady increase in trading volume and a growing number of active addresses. This suggests increasing investor interest and could be a positive indicator for future growth.Conclusion: Given the strong performance and positive momentum of FTM over the past three months, along with its current trading above key moving averages and strong support levels, there is potential for continued growth in the short term. However, it is important to monitor the coin's performance against its resistance levels and market sentiment for signs of potential reversals. Investors should also stay informed about regulatory developments and market trends that could impact the broader cryptocurrency market and, consequently, FTM's performance.

FTMUSDTI have spotted an interesting formation on this crypto pair. I believe we should go short now.
Please feel free to comment :)

$FTM Possible Double BottomKUCOIN:FTMUSDT - Huge Double Bottom possibly in print
Measured move +40%
Divergence at support in 0.635 levels would be preferred entry provided entry trigger activates via candlestick or candle stick formation.
Neckline break and retest at 0.78 level will provide further impetus for initial Target to 0.94.
Remember UPCOM:FTM can go higher can is dragged around like all altcoins by the ring master $BTC.
Always having Plan A and Plan B scenarios so we can react once the markets provide an opportunity to execute our edge.
If you liked this idea or if you have your own opinion about it, write in the comments.
The information and publications are not meant to be, and do not constitute, financial, investment, trading, or other types of advice or recommendations.
