FTMUSDTHello Crypto Lovers,
Mars Signals team wishes you high profits.
This is a 4-hour-time frame analysis for FTMUSDT
As we analyzed on March 14, we expected a rise to happen and here we see a noticeable rise after a little decline which means our expectation took place correctly. Here we have R1 and R2 as the resistance areas that express the price was not able to rise at different points. And S1 and S2 are our support areas in this chart containing the support of price even since the past. Thus, we have the price fluctuating over S1 area after being rejected at R1 and we expect it to make two scenarios available here. By having some rising signs and more fixation, we would wait for an increase up to R2. So if we receive some confirmation candles to rise, an increase would take place for the price to break R1 upward and even move rise toward R2 area would happen in case the price is supported at R1. It is also probable that if the price is capable of breaking R2 upward, the possibility of rising to its last peak is so high. But if the price is not supported, more fall is predicted there for it to touch lower amounts. Then surely if the price falls below S1, more decline will happen to it. We suggest you to put your stop-loss point below our first support area for not losing more profits and experiencing more logical trades. Please do not forget to wait for some signs such as confirmation candles in order to make sure of what will be your next movement and then act wisely.
Warning: This is just a suggestion and we do not guarantee profits. We advise you to analyze the chart before opening any positions.
Wish you luck
FTMUSDT trade ideas

FTM | Bears Are Taking Control of The PriceF TM | Bears Are Taking Control of The Price
During the last hours, it looks like the bears are taking control of the price.
We can see a solid 4-hour candle that already closed below the structure.
The chances are very high that it can move down further if the resistance area located
near 0.4430 will stop the price from rising more.
Next support and target zone should be near 0.390 and 0.33
Thank you and Good Luck!

Mock Up Price Action for FTM I'll Be Tracking | Mid TermMock Up Price Action for FTM I'll Be Tracking | Mid Term

FtmusdtReady to blast wait
For confirmation
Good time to entry
Follow me for more subscribe and share your friends

#FTM #crypto #Signal15 min time frame to identify the breakout of resistance and divergence.
Note: Always trade with proper risk management and a solid trading plan. The white, red, and green lines can serve as potential signals for entry, stop loss, and take profit, respectively, based on your analysis. Monitor the price action closely and adjust your trade accordingly.

FTM/USDT IN A BULLISH FLAG PATTERNFTM/USDT is in a bullish flag pattern and if it breaks above the top of the Flag Pole can be a good call for long position.


Short FTM, Guys we are praying that alt season is here...Let us Nuke this before we start picking them back on the way UP. PUMP!!

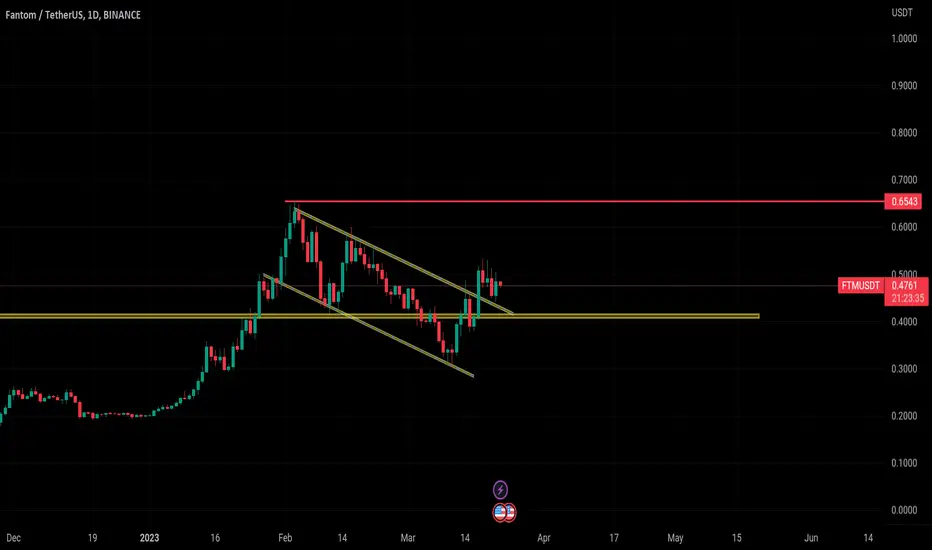
FTM succeeding retest
FTM prices broke the descending channel and is finalizing the retest.
In case of a successful retest (1D TF), a referenced setup is as in chart.

SasanSeifi 💁♂️FTM/USDT 3D UPDATE✅ 55%😍🔥🔥HI TRADERS✌ As I expected. In the long term, after the correction, the price faced buying pressure from the 0.30 range and was able to grow more than 50%. 😍🔥🔥✅
Currently, the price is trading in the range of 0.45.
If the candle closes above the 0.44 range in the 3-day time frame, the possibility of price growth up to the 0.52 / 0.57 / 0.66 range can be considered.
We have to see how the price will react...
Maintaining the 0.30/0.33 range is important to continue the positive trend.
❎ (DYOR)...⚠⚜
WHAT DO YOU THINK ABOUT THIS ANALYSIS? I will be glad to know your idea 🙂✌
IF you like my analysis please LIKE and comment 🙏✌

FTM ROADMAPHi, dear traders. how are you ? Today we have a viewpoint to BUY/SELL the FTM symbol.
For risk management, please don't forget stop loss and capital management
When we reach the first target, save some profit and then change the stop to entry
Comment if you have any questions
Thank You

FTMUSDT wants the breakout?FTMUSDT is currently testing the 4-hour resistance level after a clear breakout from the daily dynamic resistance. This breakout is a positive signal for the cryptocurrency, indicating that it may be heading towards higher prices.
In addition, the price has formed a double bottom pattern at the 0.618 Fibonacci level. This is a bullish signal indicating that the cryptocurrency may be preparing for an upward move. If the price manages to break out of the current resistance level and confirm the breakout, it may signal a new long opportunity, according to Plancton's rules.
–––––
Follow the Shrimp 🦐
Keep in mind.
🟣 Purple structure -> Monthly structure.
🔴 Red structure -> Weekly structure.
🔵 Blue structure -> Daily structure.
🟡 Yellow structure -> 4h structure.
⚫️ Black structure -> <= 1h structure.
Follow the Shrimp 🦐

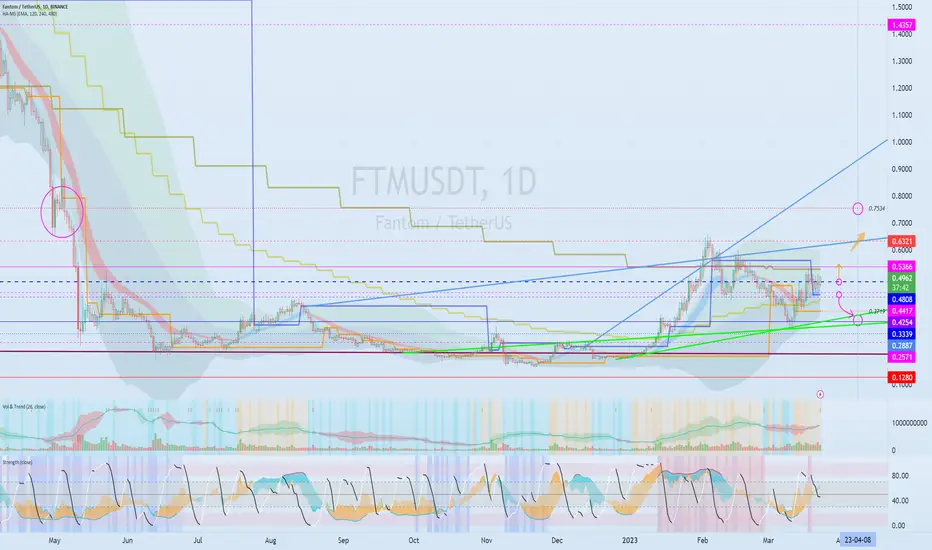
Significance of the interval 0.5366-0.6321...Hello?
Traders, welcome.
If you "Follow", you can always get new information quickly.
Please also click "Boost".
Have a good day.
-------------------------------------
(FTMBTC 1W chart)
The key is whether it can rise with support around 0.0000 1686 ~ 0.0000 2029.
--------------------------------------
(FTMUSDT chart)
(1W chart)
The question is whether it can hold the price above 0.4254 and rise above 0.6321.
(1D chart)
The key is whether it can rise with support around 0.5366-0.6321.
Therefore, if it rises above 0.7534, it is expected to show a sharp uptrend.
To do so, we need to see if the price can be maintained around 0.4808.
A drop from 0.4808 is likely to touch around 0.3339-0.3719.
-------------------------------------------------- -------------------------------------------
** All descriptions are for reference only and do not guarantee profit or loss in investment.
** Even if you know other people's know-how, it takes a considerable period of time to make it your own.
** This is a chart created with my know-how.
---------------------------------
#FTM LongIn a lower cycle in the correction wave 2, it can finish in the specified area enclosed in the channel of this correction and grow up to the 75 cent zone of the three rising wave.

#FTMUSDT #LQR #TOBTC #LaqiraProtocol The price can test the previous Level of 0.6500-0.6700 once again, if confirmed, you can open a trade, the next resistance is based on the confluence of Fibonacci Level and static levels in the specified chart. Support Level 0.3800 - 0.4100 and 0.3400 - 0.3100 In case of price fall after confirmation you can open a trade this analysis is not a buy or sell offer

FANTOM- New Flight Inbound 💎👻Nice breakout for FANTOM yet it looks so 'Young and promising'.
0.4454 is now Triple support and that allows for a comfortable SL below that level (risk) and a much higher reward:
0.90 is the next target and it could be soon (2 months?)
1.32 - 2.05 - 2.56 are reasonable targets that we could see between end of 2023-mid 2024
4$ remains my target for FTM. Same as it was last year (was never met during last cycle).
NEWS:
💎 Fantom reveals 30 years runway (without having to sell its token)
The Fantom Foundation’s attempt to dispel concerns about potential FTX exposure has been a success thus far for FTM price.
💎 Fantom releases decentralized funding system called ecosystem vault :
QUICK TAKE
Fantom has released a decentralized funding system to finance new projects, dubbed the “ecosystem vault.”
The vault will get 10% of all transaction fees paid on the network, which will be granted to projects.
To apply for funding, projects will have to make a governance proposal and get approved via an on-chain vote.
FANTOM is awesome and I believe it can stand out.
One Love,
The FXPROFESSOR
WE CAN REPEAT BX12 AND MORE HERE:


Fantom weekly just getting startedFTM weekly shows a more conservative view when compared to the run in 2021 but still any moves in the 1000%s deserve close attention imo the DeFi god is just getting started

FTMUSDTFTMUSDT is in a rising wedge and we can take a short entry if the price breaks below the last higher low, TPs and SL are mentioned on the chart.


To 1$ this time?Ftm looks so good in daily chart after consolidated a bullish flag pattern
We can see the upper side of the flage is gather with 0.618 golden fib level in a point we called a confluence point
Confluence point is a zone which many resistance gatherd in and it require a huge liquidity to break it
We can see many trials to break this point in daily chart...we can see Ftm raise to 1 $ after breakout the upper side of the bullish flag
Don't forget to support us with ur like, comment and follow for more ideas and updates🎯

ftm can make a correctionHi, dear traders. how are you ? Today we have a viewpoint to SELL/SHORT the FTM symbol.
For risk management, please don't forget stop loss and capital management
When we reach the first target, save some profit and then change the stop to entry
Comment if you have any questions
Thank You
