FTMUSDT trade ideas
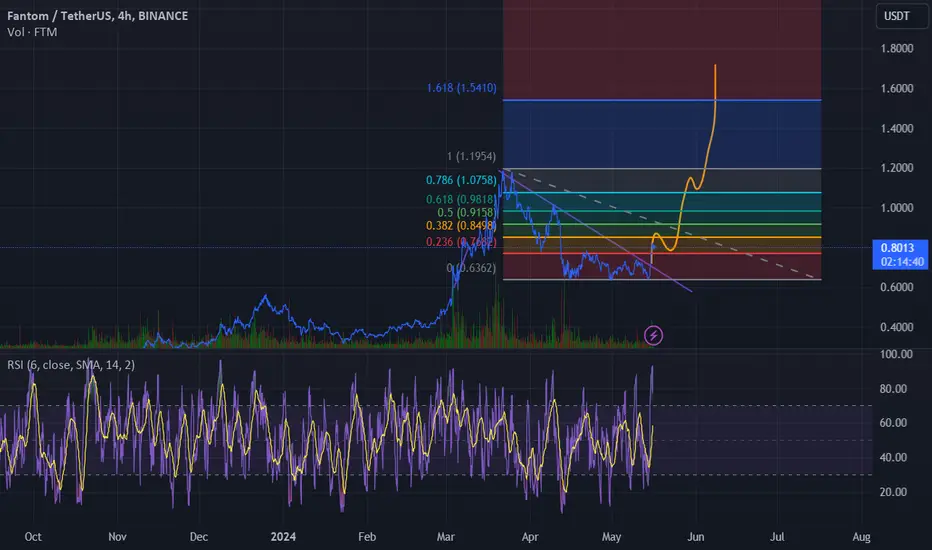
FTM To 1.7 and beyondHey guys! this is a no brainer trade here ;) tripple bottom and all market green

FTMUSDT IDEAHey traders hope you are enjoying our analysis. Now we are here again with a new trading opportunity. We will discuss today about FTM
FTM THE Falling Wedge pattern Breakout Has Already Done in 12H Timeframe ✅
Running in 10% profit so far ✍️
Expecting 40% Bullish wave in Coming days🚀📈

FTM: best bull candle📊Analysis by AhmadArz:
🔍Entry: 0.743
🛑Stop Loss: 0.708
🎯Take Profit: 0.771 - 0.817 - 0.914 - 1.121
🔗"Uncover new opportunities in the world of cryptocurrencies with AhmadArz.
💡Join us on TradingView and expand your investment knowledge with our five years of experience in financial markets."
🚀Please boost and💬 comment to share your thoughts with us!

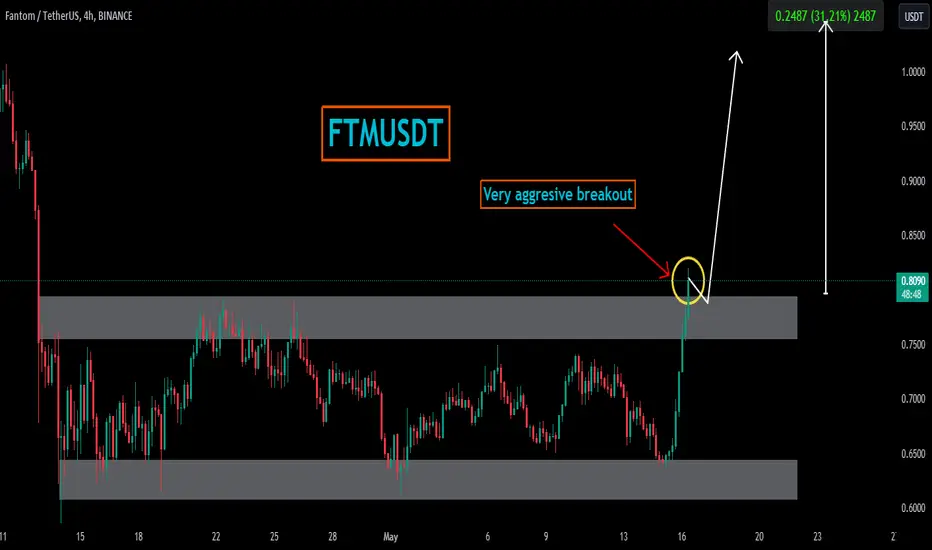
FTMUSDTFTMUSDT was being accumulated from couple of weeks and was traded in range bound.
later buyers took the charge and decided to put it in clear direction and has given breakout of range tight market.
Breakout is seems very strong and if this breakout sustains then the next upside target could be
1.05 which is decent 30%.
FTMUSDT UPDATE #FTMUSDT
UPDATE
Hey dear traders hope you are enjoying trading and analysis with our team. we are here to discuss about FTMUSDT
Falling wedge breakout done in 12h Time frame ✅
Expecting massive Bullish wave 🚀

FTMUSDT UPDATE#FTMUSDT (Update)
Hey all friends and traders. Hope you are enjoying our analysis. we are here to analyze FTMUSDT today.
Descending triangle breakout done in 12H time frame.
Expecting Massive Bullish wave🚀📈

Fantom breakout incomingFTM 1day putting in higher lows off the local bottom but needs to start closing outside 0.75 area to hit higher highs Price is breaking out of the downward trendline that took FTM on a 54% correction before wicking to the bottom Bollinger bands are in the squeeze and so back the breakout On the contrary to this idea the Velo data suggests that this latest move is primarily leverage trading which is not perfect and could see more volatility Spot buyers stepping in will confirm the trend change is real MACD is good to go and an rsi above 50 all looks real but we need to see Spot returning

FTM Testing Diagonal TrendlineWe can see that FTM is making bullish trend once it make the breakout we will see a bullish movement and aim for 0.80,1,1.20 and after retest the final move towards its main resistance and demand area 1.6

#FTM/USDT is testing the Diagonal Trendline in 4-Hour TF!#FTM/USDT is testing the Diagonal Trendline in 4-Hour TF!
UPCOM:FTM needs to clear the Diagonal Trendline to gain the bullish momentum. Wait for BO/retest to open a long position. The local resistance level is $0.7485.

FTMUSDT, Going up for long term holderWelcome, Trader. Welcome to our crypto community! 🚀We are delighted to welcome you, whether you are an experienced trader or new to cryptocurrency.
We are willing to discuss #FTMUSDT💹.
#FTMUSDT 🔥🚀.
___________
Update:
Time Frame: weekly
➡️ FTMUSDT has formed a consolidation zone. ➡️ Breakout confirmation is already completed 🚀.
➡️ Retest confirmation is already completed.
➡️ Awaiting weekly candle closing. ➡️ We anticipate a 150% increase in the near future. 👉✅.

💡📈 "FTM Coin Analysis: Trends & Opportunities" 🚀🔍🔍 Let's conduct an in-depth analysis of the esteemed cryptocurrency, FTM, and identify our potential setups in the lower timeframes.
📊 In the weekly timeframe, contrary to the majority of coins, FTM has broken free from its prolonged weekly range after approximately 600 days, advancing towards the significant resistance level of 1.0950. This bullish movement was corroborated by an increase in volume, affirming the trend.
🔻 Upon encountering this resistance and with sellers re-entering the market, red candles reappeared, driving the price down to 0.6326. Nevertheless, this decline was marked by a reduction in volume, which underscores the robustness of our upward trend, suggesting that this may merely be a pullback to the weekly range.
🧐 I delved deeper into the nature of such movements to ascertain the underlying causes. It appears that traders who liquidated their holdings at the resistance and now observe FTM's commendable upward trajectory are motivated to reacquire their positions at the same price levels, thus transforming the previously breached resistance into a pivotal support through their buy orders.
📉 Now, let's shift our focus to a lower timeframe for futures trading analysis. For short positions, our support is well-defined, and upon breaking the critical support at 0.6326, we can initiate a short position aligned with our 4-hour trend. However, it is imperative to confirm the increase in volume at the time of the break.
⚠️ Given the significance of the 0.6326 support, if we notice volume rising as we approach this level and the RSI nearing oversold territory at the 30 line, you can also set a stop-sell order to capitalize on any sharp movements.
🔄 For a long position, we currently lack a clear trigger, but considering the weekly movement, we can hypothesize that this support may serve as a reversal point. Nonetheless, we will refrain from acting until we receive confirmation. For a riskier long position, we will await the 0.7300 level, and for a more secure long position, we will wait for a break above 0.7838.
🪙 In today's market, your trades should be closely aligned with Bitcoin's movements, given that BTC.D (Bitcoin Dominance) commands a significant portion of the market. Essentially, Bitcoin dictates the supports and resistances on the charts of other cryptocurrencies.
❌ Consequently, it is advisable that if altcoin support and resistance levels are breached but Bitcoin does not provide confirmation, you should enter positions with reduced risk. For instance, if FTM loses the 0.6323 support but Bitcoin maintains support at 60706, FTM is likely to hit its stop loss. However, if Bitcoin loses its support, FTM is poised for a more substantial decline, potentially yielding significant profits.
⏳ At present, we do not have an entry point for repurchasing this coin. Exercise patience and explore other projects during this period. Additionally, you might consider examining the DeFi space within the Fantom chain.
📊 Our upcoming support levels are 0.5472, 0.4903, 0.4380, with the resistances at 0.7300, 0.7838, and 0.9096.
😊 If you'd like me to analyze a specific coin or currency pair, be sure to comment so that I can allocate the next analysis for you!
⚠️ Also, please remember that I'm just an analyst, and this isn't financial advice. We're here to stay in the market and maximize profits by adhering to risk and capital management principles.

📉📈 FTM Forming A Bearish Wedge 🔄💼Trade Overview:
FTM is forming a bearish wedge pattern, suggesting a potential downward move, particularly with the anticipation of bearish news this week.
Trade Strategy:
Entry: Consider laddering into spot positions between $0.55 to $0.45, allocating 50% of the position within this zone.
Confirmation: Look for price to close above the 200-day MA on the daily timeframe within this zone, indicating bullish momentum and flipping the zone into support.
Take Profit: Set a take profit target at $0.80, with the next area of resistance at $1.
📊🔍 Monitor FTM's price movement closely for entry confirmation and adjust strategy accordingly! #FTMTrading #CryptoAnalysis 🌐🔒

Ftmusdt trading opportunityFTMUSDT has reached a strong support zone, which is also serving as an important support level. The recommendation is to shift attention to a zone identified as the Neckline, with the immediate Buy Back zone marked as an area for replenishing holdings for those not currently invested in the coin.
The final setup target is projected to be around the determinant trendline as indicated on the chart.
Your engagement and likes on this analysis are greatly appreciated.

We need something like this heheFTM! boolish! the BTC dominance will be decreasing the following days, so we can see some price recovery in alts (I think) AVAX, and more alts seems identical

FTMUSDT IDEAHello Traders Hope You Are Enjoying Our Analysis. Today We Will Discuss About FTM
(Update)
12H Timeframe⏳
The Falling Wedge Formation☑️
In Case Of Successful Breakout Expecting Massive Bullish Wave✈️

FTMUSDT 12HFalling wedge formation on the #FTM 12h timeframe. It is moving above the MA50 and MA200. FTM is testing the falling wedge resistance. In case of a breakout, the targets are:
$0.8081
$0.9074
$1.0303
$1.2289

~~~~~ FTMUSDT UPDATE ………………#FTMUSDT
UPDATE
Hey dear members hope you all are enjoying our ideas and analysis. Now we are here to discuss about FTM
FTM is ready to fly. In this move we can see gain here upto 80%+ soon ✍

FTM Price
The Fantom (FTM) crypto price trades in a narrow range and is displaying low investor interest this week.

#FTM/USDT ANALYSIS FTM is currently moving within a symmetrical#FTM/USDT ANALYSIS
FTM is currently moving within a symmetrical triangle pattern. It is showing signs of rejection from the trendline and encountering resistance from the MA 200. Meanwhile, the Ichimoku cloud is serving as a support level. We need to patiently await a clear breakout or breakdown of the triangle to confirm its next direction.

Fantom (FTM): Possible Zone of Rejection / EMAsFantom caught our attention with the nice rejections near 100EMA that we have been having recently.
We have now approached that same 100EMA again and got rejected, but the price is showing some kind of upward momentum currently.
We are keeping an eye on both EMAs here for a potential rejection to happen, which would result in a movement towards our lower support zone / target zone.
Swallow Team

FTMUSDT IDEAHey traders hope you are enjoying our analysis. Now we are here again with a new trading opportunity. We will discuss today about FTM
FTM Successful breakout has 12H Time frame ✅
Retesting in process ✍️
Expectin +20% bullish wave in Coming day's 🚀

FTMUSDT.1DAnalyzing the daily chart for FTM/USDT provides insights into the current market conditions and potential future movements based on technical indicators and chart patterns.
Key Resistance and Support Levels:
Resistance 1 (R1): $0.5275 - This price level has been tested recently, and it may continue to offer resistance to upward movements.
Resistance 2 (R2): $0.8230 - A more robust level that was previously a high point before the recent decline.
Resistance 3 (R3): $1.0763 - Represents a significant high and a strong psychological barrier.
Support 1 (S1): The chart does not specify the exact value of S1, but it's indicated below the current price level, providing a potential target if the price continues to fall.
Technical Indicators:
Relative Strength Index (RSI): The RSI is at 42.48, which suggests that the asset is neither in the oversold nor overbought territory, but it is leaning towards bearish sentiment as it is below the neutral 50 mark.
Moving Average Convergence Divergence (MACD): The MACD line is very close to the signal line, indicating a lack of strong momentum in either direction. This setup typically suggests a market in consolidation or lacking strong buyer or seller engagement.
Trend Analysis:
The descending trend line from the recent highs indicates a bearish trend. The price has been making lower highs, which typically suggests continuation of a downward trend until a clear breakout above this trend line occurs.
Conclusion:
The FTM/USDT market is currently showing signs of bearish pressure as indicated by the descending trend line and the positioning of the RSI below 50. For traders, the approach towards the resistance level at $0.5275 will be critical. A failure to break this level could see the price retest the lower support levels, where buyers might see opportunities for entry. A successful break above R1, however, could signal a reversal or weakening of the current bearish trend, potentially aiming for R2 at $0.8230.
Given the current MACD readings and the proximity of R1, traders should remain cautious, watching for either a bullish breakout accompanied by increased volume or a continuation of the bearish trend with potential entries near lower support levels. Setting stop losses just below the recent lows can help manage risk in case of further downward movement.
