FBMKLCI trade ideas

Symmetrical Triangle for Bursa KLCI! Bull or Bear?14th June 2021
The FBM KLCI finished 0.46% or 7.3 points higher at 1,582.46 in line with gains in regional markets. It a good start to the week but also a challenging week. The local political front, uncertain over the outcome from the Agong's meeting with the council of rulers this Wednesday, expect investors to stay sideline waiting for the final outcome.
The KLCI weekly chart, it showing a Symmetrical Triangle . Pray hard to coming Wednesday something positive after the Agong's meeting, most likely the KLCI index would challenge Resistance 1,600 point. But if negative, Index could break Symmetrical Triangle support and go hovering at 1,540-1,550 points.

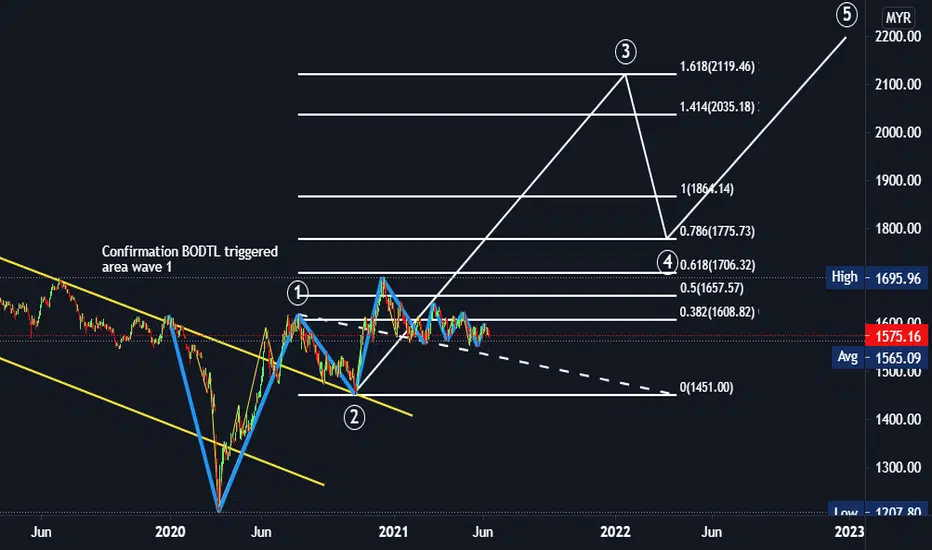
BURSA INDEX KLCI GOOD FOR INVESTMy prediction BURSA INDEX Malaysia will rebound back soon. Still in sideway wave 2 ZIG ZAG
Method using Wave + Fibo Extension + Trendline BODTL
MCO 1.0 - the returnAs Malaysia prepares for the return of MCO 1.0, I thought it'd be useful to see what happened in the days after the MCO announcement on 16-Mar-2020.
Sectors that beat the KLCI in the period since:
1) Healthcare
2) Technology
3) Industrial Products
4) Transportation
5) Telecommunications

Fly like a butterfly KLCIHello there, happy eid-alfitr to my muslim friends.
Its been a while since my last post. This is my 2cents for KLCI.
1. Butterfly pattern which indicates the probability of reversal at the price area 1800
2. In addition, the trend for KLCI in a longer term timeframe we can say still heading towards uptrend and might be waiting to see the direction to be changed.
3. Support level at 1452, once broken we wont be using this pattern anymore.
Conclusion from this pattern is, we are optimistic that KLCI will be doing reversal at the price area and probably to retrace at 1588.... worst case for a correction at 1422.
Well, dont ask me like "bila nak naik" and sort kind of question cause no one ever know what will happen tomorrow.
Lets manage your trading plan well aite ?
The idea is only for educational purposes and not giving any suggestion for you. And please do trade at your own risk


FBMKLCI - ConsolidationThe consolidation period in the KLCI chart may be caused by the recent MCO announced by the government. It may trigger an alarm as the support area has been tested four times. Next is to monitor if the price rejecting or vice versa at the 50 SMA (red) level.

FBMKLCI - Short term KLCI short term view..overall still in corrective move..wave Y in an ABC corrective wave since 10 March 2021..this week we shall see market should trend higher to complete wave 4 of wave C before going downwards again to complete the wave C of Y..

FBMKLCI - Major Correction Since July 2018 Extreme HighFBMKLCI.. long term view doesn't looks good..recent high from march 2020 till today looks like a correction move wave X from the main downtrend move since July 2014..my forecast for long term move, our klci will continue downtrend to complete wave Y at around 1200 points as long as price didn't break previous extreme high wave B at 1900.

KLCI Waiting To Break DowntrendlineSektor yang boleh diperhatikan
1. Technology
2. Oil & Gas
3. Palm Oil
4. Metal
5. Gold

KLSE in a caution trade.Due to this longer pandemic, no body will know until when this will last. Malaysian government, is very caution for the economy. Total lock down will make economy more worsen , and hard to awakening. The pattern is likely to challenge all the supports, but if there is a high demand of economy ... perhaps the trend will obey the uptrend channel.

Traditional|FBMKLCI|Long and shortLong and short FBMKLCI
Activation of the transaction only when the blue zone is fixed/broken.
The author recommends the use of anchoring fixed the blue zone, this variation is less risky.
If there is increased volatility in the market and the price is held for more than 2-3 minutes behind the activation zone after the breakdown, then the activation of the idea occurs at the prices behind the activation zone.
Working out the support and resistance levels of the consolidation zone.
* Possible closing of a trade before reaching the take/stop zone. The author can close the deal for subjective reasons, this does not completely cancel the idea and is not a call to the same action, you can continue working out the idea according to your data, but without the support of the author.
+ ! - zone highlighted by the ellipse is a zone of increased resistance, in this area there is a possible reversal for a correction, please take this factor into account in this transaction.
The "forecast" tool is used for more noticeable display of % (for the place of the usual % scale) of the price change, I do not put the date and time of the transaction, only %.
The breakdown of the upper blue zone - long.
Breakdown of the lower blue zone - short.
Working out the stop when the price returns to the level after activation + fixing in the red zone.
Blue zones - activation zones.
Green zone - take zone.
Red zone - stop zone.
Orange arrows indicate the direction of the take.
Red arrows indicate the direction of the stop.
Priority - The value of the priority parameter implies the author's subjective opinion about the more likely activation zone on this idea, this does not mean that this idea will be 80% activated by this parameter, the purpose of the parameter is to provide for the risk of the inverse of the zone parameter.
Example: "Priority Long: So the author inclines more in the direction of the activation zone open long trades, in this case, when reaching the activation zone in short you should be very careful, because this area may be highly likely to be punched about the breakdown/do not get to take/activate transaction from go to stop."
Please consider this parameter if you use my ideas.
SUM PNL: This parameter displays the total % of all closed ideas of the "new" format (according to the author) for this sector at the time of publication of the idea. The calculation is very "clumsy" just the sum of the profits of all the ideas, based on this indicator, you can more accurately assess the risks when working with my ideas of this sector. I present you the construction of the idea, you can use it yourself as you like based on your subjective view and risks, the calculation of the PNL indicator is carried out only on transactions that the author closed on TV in manual mode or by take.
P.S Please use RM (risk management) and MM (money management) if you decide to use my ideas, there will always be unprofitable ideas, this will definitely happen, the goal of the system is that there will be more profitable ideas at a distance.

FBMKLCI - Major Correction Since December 2020 Extreme HighKLCI forming a corrective wave pattern from last extreme high december 2020.
Price may move towards 1641 to complete a 3 waves up for wave X before continue downward in 3 waves moves to complete wave Y.


FBMKLSE ready for another rally soonAfter few months of consolidation, markets come to an end of testing the downside.
I'm looking at the first target of reaching 1659 :)
Energy, Finance, Healthcare sectors will be leading the market.

KLCI - Correction ended soonWe suggest KLCI has reached 1769.43 - 1638.81 Price action zone.
Formation X wave might have ended.
Invalidation - 1894.95
Target - 1208.18

KLCI forming bottom Following my last post, that KLCI retraced on 33% on the daily chart, (refer to my last post on KLCI), it seems that on March 26, KLCI retraced at 33% on the hourly chart as well.
KLCI rallied on at the last hour, pretty much the same as SPX which rallied on the last 2 hours on March 26.
Expecting the general markets to go up from here

KLCI right on 33% retracement March 25 - The bursa KLCI index should be on the way up today.
Oil stocks should fare well as Crude rose by more than 5% overnight.
Nothing much to say beyond this.

KLCI Up Trend In TactOverall KLCI still in up trend. Strong support @ 1612... POSSIBLE retrace tp the support and go up.....
