0Q3 trade ideas

BYNDUp there with my favorite charts right now, especially if it holds above $167 after some consolidation. Then back up to recent highs and onward to $358. Double bottom from the IPO price into an inverted head & shoulders. Pretty textbook so far, we'll see if it holds.

$BYND Beyond Rallies when others Falter The Fibonacci Golden pocket Broke today on high volume, further gains
were hampered by market weakness.
Tomorrow there may be a trade above the $158 level with $162 as the first target.
Previous major pivot point $167 is very achievable by weeks end.
Short interest can help fuel the rally further.

I got no love for this BYND call around $123 per share...NASDAQ:BYND
...but it has moved $33 per share since then. Cashed in on this big winner today. Will revisit again.
The call was at $123 and it hit $158.60 today. My calls just keep working. some just take some patience.

Target 300?It is possible as long as it stays above that pink line and above 166. Sell if it goes below pink line.

BYND Base FormingLooks like the right side of a technical base forming for this maker of fake meat. Three year sales growth rate of 189%. Profitable.


$BYND Beyond Meat Causing shorts some worry
Quite a week for BYND with multiple positive news events, currently up 17% for the week.
If market is positive today it may be possible to trade back up to the Fibonacci resistance at $150.
Longer term holders could have a more defined stop loss now below $138
Alert also set for move above $151 for a major rally setting up.
Short interest 13% so some covering may occur.


BYND - breakoutBYND - breakout on news: partnership with TACO
I was watching the stock for a while as it made a beautiful bullish wedge.


PAY to BEYOND MEAT DailyHello people, BEYOND MEAT is in a fake bearish push with a large buying volume and we see a desperate attempt by buyers. But despite all its signs it still asks to go up, on the TIMEFRAME 1 Min we see a refusal from the sellers. BEYOND MEAT moves towards its last precedent lower to then turn around. Strong potential to close the bullish gap and go the next bearish decision candle, Not enough force to reach its median.
Please LIKE & FOLLOW, thank you!
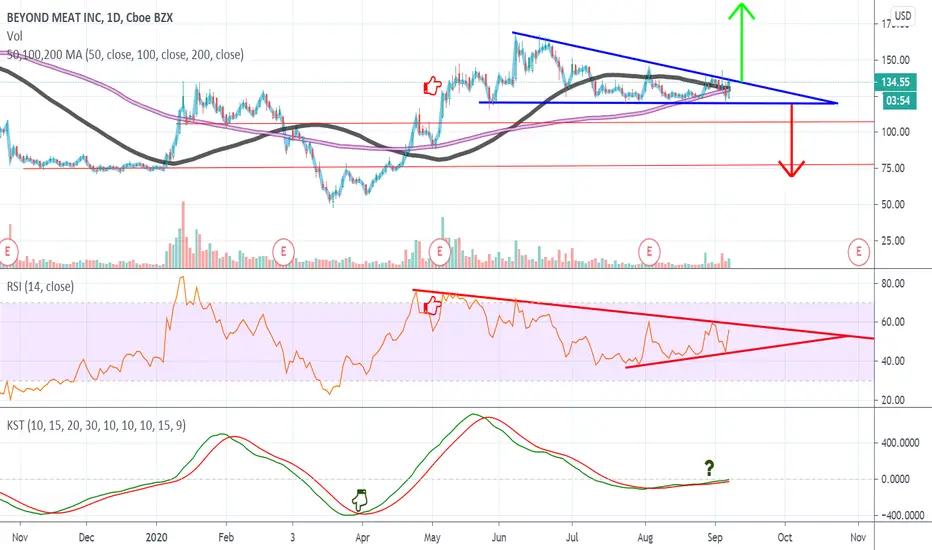
Bullish Flag or Descending Triangle for BYND?On the RSI there was a noticeable bearish divergence that started in May where I have the red finger pointing sideways, meaning, the price was increasing but the RSI was decreasing, it appears as though the divergence has completed.
On the KST there's potentially a bullish cross happening, I have placed a green finger icon to represent a previous bullish cross, and a question mark to represent where there's one potentially happening now.
BYND BULLISH 15M SETUP FROM 4H 1DDay Candle shows Bullish setup.
4H candle shows Bullish setup.
15m candle shows BULLISH ENTRY SETUP.
Watch for a current
Bullish Reversal
candle close pattern on
15m candle @ 137.74 then BUY

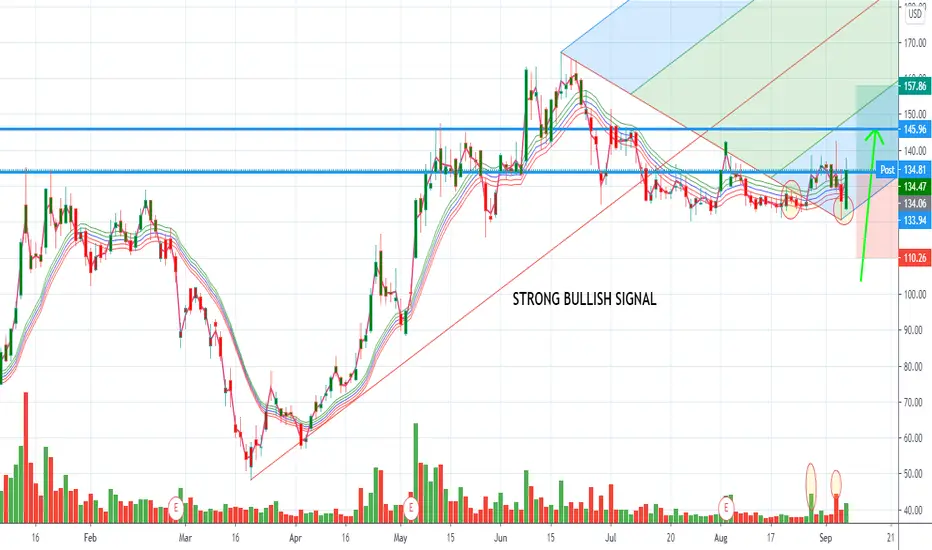
BYND at VWAP support move up to $165 and stop loss $116$BYND Now holding up the VWAP from march lows and consolidating. Looking for that upside move at the end of the wedge. Target: $163 with StopLoss $116

Why wont this script actually plot the open and close prices?As you can see on the chart, the open and close prices are not where the lines are. Please help.
Thank you
// This source code is subject to the terms of the Mozilla Public License 2.0 at mozilla.org
// © bradchris24
//@version=4
study("Short Term Levels me", shorttitle="STL", overlay=true)
t = time("1440", "0000-0930")
dclose = security(syminfo.tickerid, "D", close )
dopen = security(syminfo.tickerid, "D", open)
is_first = na(t ) and not na(t) or t < t
ending_hour = input(defval=9, title="Ending Hour", type=input.integer)
ending_minute = input(defval=30, title="Ending Minute", type=input.integer)
day_high = float(na)
if is_first and barstate.isnew and (hour < ending_hour or hour >= 16 or hour == ending_hour and minute < ending_minute)
day_high := high
else
day_high := day_high
if high > day_high and ((hour < ending_hour or hour >= 16) and hour < 16 or hour == ending_hour and minute < ending_minute)
day_high := high
day_high
plot(day_high, style=plot.style_line, color=color.yellow, linewidth=1)
plot(dclose, style=plot.style_line, color=color.green, linewidth=1)
plot(dopen, style=plot.style_line, color=color.red, linewidth=1)


BEYOND MEAT, Above and Beyond $BYNDThere is a big freaking triangle forming on the #BYND price chart... can be bearish.. but can rocket if the right news is issued in the next week.
Price has been squeezing for a while now, will be released sooner than later, direction is hard to predict though.
High profitable trade, with tight stop loss under the below structure.
PT1:140
PT2:150
PT3: if Beyond defeats the COVID ->165
STOP: 120
Give at least 7 days to play the scenario out.

BYND: EW count indicates Wave 3 startedQuick EW count of BYND indicates an price has started a wave 3 of some degree. The corresponding wave 1 contains an extended wave 1 of a lesser degree that goes from about $48 to $147.
Blue line is low price, black line is closing price, and red line is high price.

BYND: Buy at 142.61 with profit target at 208.95BYND, Beyond Meat, could have a potential Flat Base breakout next week. On 08/27 there was a potential gap up buy but it closed below the 50DMA, which is a sign of weakness. It is now making another attempt to close above the 50DMA then the 10WMA. If the price holds above the moving averages level and consolidates a bit there is a potential buy next week at 142.61. Then the next level to watch would be a close above 167.26. If the price does close above 167.26 then the volume better be at least 50% or else that would be a sell.
The fundamentals are looking great. Sales and EPS are both increase and top fund like Federated Herm Kaufmann Small Cap (FKASX) owns it too.
Yearly EPS
2017: -.51
2018: -.49
2019: .04
2020: .10 estimated
2021: .60 estimated
Sales Quarterly Increase
Sep-19: +250%
Dec-19: +213%
Mar-20: +141%
Jun-20: +69%

BYND - 9/18 150 callsThe box on RSI shows a double dip of the 7-day RSI. 14-day has not touched the 50 line but the higher open this week is a good indication.
On daily chart price has consolidated after a $100 move up and seems to be taking support off 100-day MA.
