2ON trade ideas

PTON ShortRSI divergence
Might form double top
Short 160
stop 175
Target1 140
Target2 120
I am not a PRO trader. I trade option to test my trading plan with small cost.
The max Risk of each plan is less than 1% of my account.
If you like this idea, please use SIM/Demo account to try it.

$PTON nice run this past couple daysNice run after my post about the possibility. Now printed shooting start with todays candle. Can potentially trade down to 8 & 20 MA first

PTON on the way to $200Great chat to take a look at today "PTON"
-We can see the ascending trendline and the Support resistance zone as the two key elements to understand this chart
The Ascending trendline represents the asset's long-term bullish trend, and we can see how the price is accelerating and taking distance from it.
-The Support Resistance zone was the previous level in which a huge corrective structure was formed (ABC pattern)
-After the breakout of it and a bullish impulse, we saw a corrective structure (smaller ABC pattern) finding support on the previous zone
-Now we had a breakout of the small structure, and we expect a continuation of the bullish movement towards 184.86 (First target in which we will move our stop loss to break-even) and then to the final target 205.5, where we will close our long setup
-The setup we developed was Entry above "B" and Stop below "C" (of the small corrective structure) / Break-Even and Take profit were explained on the previous items

$PTON held 20 MA today and trying to close 8 MABeen doing touch and go at 20 MA for the past few days and this seems ready to for another push into earnings. 158 would likely act as some resistance

Sunday Outlook 1/11-1/15 $MCD $V $MA $W $VMW $HD $PTONHere i take a look at some stocks I am watching for the coming week, i breakdown the current patterns i'm seeing on them and how i would play them moving forward.

PTON Trade Idea11/Jan: nice comeback from 20 MA
relatively lack of volume
Case 1: (Time Frame to 2~3 weeks)
(A)Monday first break even resistance on 162
(B)expecting pull back to 10 MA to complete handle
(C)the CUP HANDLE formed after reclaim ATH Line
(D)(E) Need volume+Catalysis to extend the uptrend
Action item: Call Opps on pull back to 10 MA
Case 2: 3-C forming (1~2weeks)
Consolidate between 162-154 with low volume
breakout with volume
Action item: Open Call with tightest price date
Case 3: Start uptrend from Monday🤷♂️

PTON - Bull Flag (Etoro Portfolio)Price uptrend (since beginning of Nov 2020), cross over MA50 (blue line) and MA20 (orange line).
Two times touch MA50 line till price 167.00 and appeared downtrend with 8 trading days to form a build up.
A price rejection : pin bar on MA20 line, draw a trendline (purple line) from first day of downtrend. RSI and MACD also in uptrend signal.
Next day a strong bullish candle breakout as confirmation and reversal buy point after that.
IBD's RS (Relative Strength) = 98, Industry Group Rank = 24 / 197
=====================================================================================================================
I will be popular investor in Etoro, take a look of my portfolio and copy me to start the trading journey.
My Etoro Profile:
www.etoro.com
Etoro Registeration Link:
etoro.tw


PTON Round UpPTON is forming a rounding up formation and it looking like it will reach recent highs at the 164 range. Also it formed a hammer doji at the bottom of the formation which is a bullish sign.

$PTON long after small pullback!Sold the 150c 1/21 bought yesterday for 120%. Sold puts to finance, double free!
So, what next? Idea is we retest the green support, before flying to ATH and beyond.
Beautiful cup and handle setup.

$PTON Peloton Wedge Break
Hopefully the chart tell you all you need,
We are trading the wedge break very successfully , looks like it has room to run.

PTON over 146.58Falling wedge here and a volume profile that sets it up for an easy bounce. Conservative initial target above at 152.95 as there is a volume node above.

$PTON is Still FallingHourly chart is currently trading below the 200 SMA. If price falls below the red line, I expect sellers to push it further down into the 130s.

PTON, Aroon Indicator entered an Uptrend on January 04, 2021.Over the last three days, Tickeron's A.I.dvisor has detected that PTON's AroonUp green line (see chart) is above 70, while the AroonDown red line is below 30. When the green line goes above 70 while the red line stays below 30, this is an indicator that the stock could be poised for a strong Uptrend. For traders, this could mean going long the stock or exploring call options in the next month. Tickeron's A.I.dvisor backtested this indicator and found 99 similar cases, 92 of which were successful. Based on this data, the odds of success are 90%. Current price $146.35 is above $123.02 the highest resistance line found by Tickeron A.I. Throughout the month of 12/01/20 - 01/04/21, the price experienced a +30% Uptrend, while the week of 12/24/20 - 01/04/21 shows a -10% Downtrend.
Bullish Trend Analysis
The Momentum Indicator moved above the 0 level on November 23, 2020. You may want to consider a long position or call options on PTON as a result. Tickeron A.I. detected that in 17 of 19 past instances where the momentum indicator moved above 0, the stock continued to climb. The odds of a continued upward trend are 89%.
PTON moved above its 50-day Moving Average on December 10, 2020 date and that indicates a change from a downward trend to an upward trend.
The 10-day Moving Average for PTON crossed bullishly above the 50-day moving average on December 15, 2020. This indicates that the trend has shifted higher and could be considered a buy signal. Tickeron A.I. detected that in 3 of 4 past instances when the 10-day crossed above the 50-day, the stock continued to move higher over the following month. The odds of a continued upward trend are 75%.
Following a +12.72% 3-day Advance, the price is estimated to grow further. Considering data from situations where PTON advanced for three days, in 82 of 88 cases, the price rose further within the following month. The odds of a continued upward trend are 90%.
The Aroon Indicator entered an Uptrend today. Tickeron A.I. detected that in 92 of 99 cases where PTON Aroon's Indicator entered an Uptrend, the price rose further within the following month. The odds of a continued Uptrend are 90%.


$PTON Peloton Interactive on Reversal Watch
Potential reversal trade in PTON,
needs to hold the gap fill at $144.88
Is that fails we will look for the Previous pivot to hold.
Short term reversal target $151.72 & $155

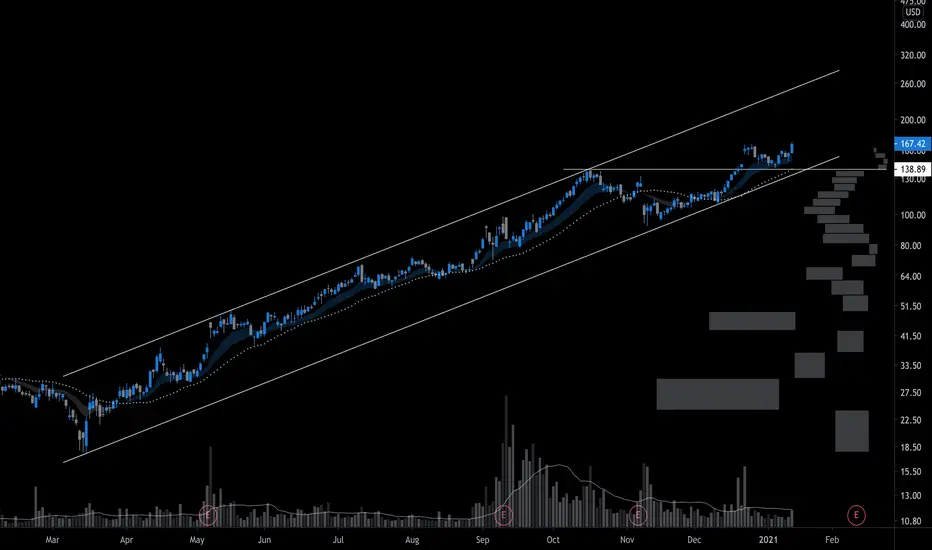
Pton broke upper channelThis stock is tricky.. The new strain of covid fear could just Fu*k this all up so trade with caution. Did a double top today when it broke upper channel. target is bottom of lower channel 130$


PTONPTON
12/29/20 1D TimeFrame
Scenario 1
- Light pullback at the 13/21 ema area
- PTON is very bullish right now in light of increasing COVID19 cases across the US. Plus their acquisition of Precor is in my opinion a bullish move; it's a good way to promote the brand to health clubs, hotels, etc.
- with a light pullback at the 8/13/21ema area which also happens to be channel median, price can potentially hit 2nd target and hopefully rally to target 3 around top of the channel.
Scenario 2
- Healthy pullback at the 50ema area
- based on previous price movement, there is a good chance for PTON to touch 50ema area which happens to be at the bottom channel area before it starts rallying up again to target 1 & 2.
MACD - Seems to be converging and histogram shows upwards momentum is running out.
Stochastics - is at overbought level and seems to start pointing down.
Disclaimer
I do not know how the market will move tomorrow. All my post is not a recommendation, advise nor a suggestion and should not be used as a replacement for investment advice from a qualified licensed professional. All my post is for practice, informational and entrainment purposes only as I am not a registered investment advisor and do not offer investment advice and recommendation. You, the reader, bear full responsibility for your own investment and trade decisions and should seek the advice of a qualified securities professional before making any investment or trade.
