$ETSY long ideaNASDAQ:ETSY is in its daily demand zone.
observed a 15 min Choch and trying to see if this would span in my way.
what do you think ?
3E2 trade ideas

Bullish Alert : ETSYThe 15 minutes chart sees a Bullish Alert and Bullish crossover.
There is a gap left open at $95.5
We need here a positive price action to be built with the next candles.

Etsy Double Bottom?Etsy forming a clean W shape double bottom. Although it has potential to the downside, with the current bulls only market environment, upside is more likely. Playing this with a tight stop. High Risk trade.

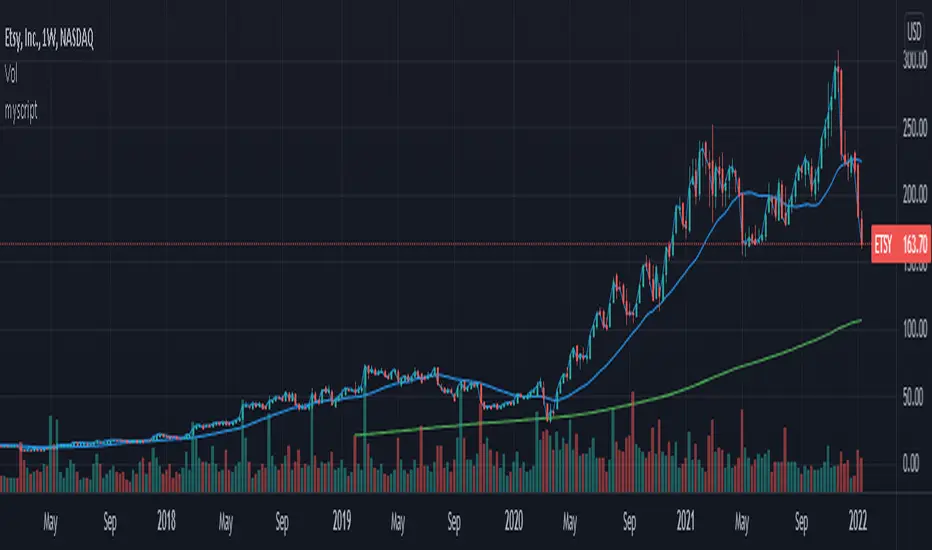
ETSY +50%Etsy, Inc. is an American e-commerce company focused on handmade or vintage items and craft supplies. These items fall under a wide range of categories, including jewelry, bags, clothing, home décor and furniture, toys, art, as well as craft supplies and tools. Items described as vintage must be at least 20 years old.

$ETSY: A Promising Comeback Candidate with a Bullish "W" PatternDuring the bullish run of 2020-2021, Etsy Inc. ( NASDAQ:ETSY ) emerged as a notable name in the US financial markets. However, the stock experienced some turbulence in recent times. In my opinion, Etsy is poised for a comeback this year, presenting a compelling short to medium-term trade opportunity.
A Bullish W Pattern Emerging
One of the key indicators supporting Etsy's potential revival is the formation of a W pattern on the price chart. The W pattern is considered a bullish reversal pattern, signifying a potential upward trend reversal. This chart pattern suggests that Etsy's downtrend may be coming to an end, setting the stage for a bullish move.
The Ideal Entry Point
For traders looking to capitalize on Etsy's potential rebound, the ideal entry point would be a daily close above $98. This level would confirm the completion of the W pattern and indicate a potential shift in sentiment. A decisive close above this price level would signal a bullish trend, making it an opportune time to consider long positions.
Price Targets for Short to Medium-Term Trades
In light of the W pattern formation and potential trend reversal, it is essential to set reasonable price targets for short to medium-term trades on Etsy. Based on technical analysis, the Price Targets for NASDAQ:ETSY are projected at $115, $122, and $128. These levels represent potential resistance points that Etsy's stock could aim to break through as it regains momentum.
Risk Management
As with any trade, it is essential to practice sound risk management strategies. Setting stop-loss orders at appropriate levels can help mitigate potential losses in case the trade does not play out as expected. Additionally, monitoring the stock's price action and overall market conditions can guide informed decision-making throughout the trade duration.
Conclusion
Etsy Inc. ( NASDAQ:ETSY ) has captured the attention of traders during its bullish run in 2020-2021. Despite facing some headwinds in recent times, the emergence of a bullish W pattern on the price chart suggests the stock may be on the verge of a comeback. For traders seeking a short to medium-term trade opportunity, a daily close above $98 could signal an ideal entry point. With Price Targets projected at $115, $122, and $128, Etsy's potential resurgence presents an exciting prospect for those seeking to capitalize on the stock's future gains. As always, diligent risk management and staying informed about market developments are crucial elements of successful trading.

ETSY Great buy opportunity on this bullish break-out.Etsy, Inc. (ETSY) pushed above the 1D MA50 (blue trend-line) today and is headed for the top (Lower Highs trend-line) of the 4 month Channel Down. That is the short-term pattern within the 1 year Triangle formation, and since yesterday was a Higher Low on its bottom, if the Channel Down breaks, we expect a strong bullish reversal.
In fact the same Double Bottom and subsequent bullish break-out can be seen in late June 2022. Our target is initially the 0.5 Fibonacci retracement level at 115.00 and after a pull-back, the 0.786 Fibonacci at 135.00 that will form a new Lower High on the Triangle. If however we see inability (straight rejection) to break above the 1W MA50 (red trend-line), we will take profits earlier, as this is the long term Resistance for the stock.
-------------------------------------------------------------------------------
** Please LIKE 👍, FOLLOW ✅, SHARE 🙌 and COMMENT ✍ if you enjoy this idea! Also share your ideas and charts in the comments section below! **
-------------------------------------------------------------------------------
💸💸💸💸💸💸
👇 👇 👇 👇 👇 👇

ETSY: Looks Promising in the Long Term but...It is worth waiting a little before putting your money in NASDAQ:ETSY . I am bearish on NASDAQ and it could pull down ETSY with itself.
(You can check my comments on NASDAQ in my profile.)
However, if you are a long-term investor with diamond hands, here looks like another good buy zone in the long term if you can bear a ~15% drop.
I am on the waiting side.

ETSY - Complete ReversalA broadening wedge or megaphone is present but it has a long way to reach the top of it. Its not impossible though, as shown with the bars pattern tool in green.
I expect a W like reversal at the bottom trend line and recovery up within the megaphone.
Daily chart.

ETSY potentially forming a broadening formationEtsy, the popular online marketplace, has recently shown promising technical indicators that could lead to a significant upside move. A bullish MA crossover and the formation of a potential broadening pattern have caught my attention.
Etsy's price chart reveals a bullish MA cross, with the shorter-term MA surpassing the longer-term MA. This suggests a potential shift in the stock's trend and the possibility of further upward movement. Additionally, a potential broadening formation, characterized by progressively wider price swings, has emerged. This pattern indicates increased volatility.
Etsy's bullish MA cross and the potential broadening formation indicate the potential for an upside move in the stock.

ETSY - Wheel Strategy - Sell PutMACD showing signs of reversal to negative
RSI at 56 - nothing to note here
Inverse head and shoulders looks to be forming. Could be good to get in around $90.
Looking at selling the $90 PUT

Bullish Alert : ETSYGreat bullish alert on NASDAQ:ETSY on the daily chart.
Price action is not yet positive and over the long term it doesn't look good.
Lower time frames are already showing a full combo.

$ETSY - Could be heading towards prior supportNASDAQ:ETSY Looking like it can get to $74 - $70 area which could be interesting area to play the bounce. $70 area had previously provided support. Watching for now.

$ETSY Swing TradeEtsy is at the early stages of a failed breakdown and is showing bullish divergence. A close above $98.11 will confirm this and will mark a great entry. Given the low cost of option calls for next month I entered a few $120 strike for $0.15. Looking forward to this trade. Low risk, high reward.

bearish on etsy?bearish on Etsy?
High growth tech under pressure, purely based on technicals this is heading to 100 or somewhere in that range.
Tactic: Invest at first profitable quarter. Case study: ETSYTactic: Invest at first profitable quarter and hold.
Case study: ETSY pre-covid chart. Post covid high of like $300 is too silly to show.
Note:
#1. Apr'15. IPO madness of $32 died down to $8 after about 6 months.
#2. Mar'16First profitable quarter at $8, then profitability backslid but that was the new price low. If buying and holding at point #2 until point #4, total gain of 775% in 3 years. Annualized 106%.
#3. Jun'17After 14 months until the next profitable quarter, price was $15 a gain of nearly 100%. Despite that increase, that would be the new low.
#4. Mar'19 price climbed to $70 with volatility.
MZ May 2023

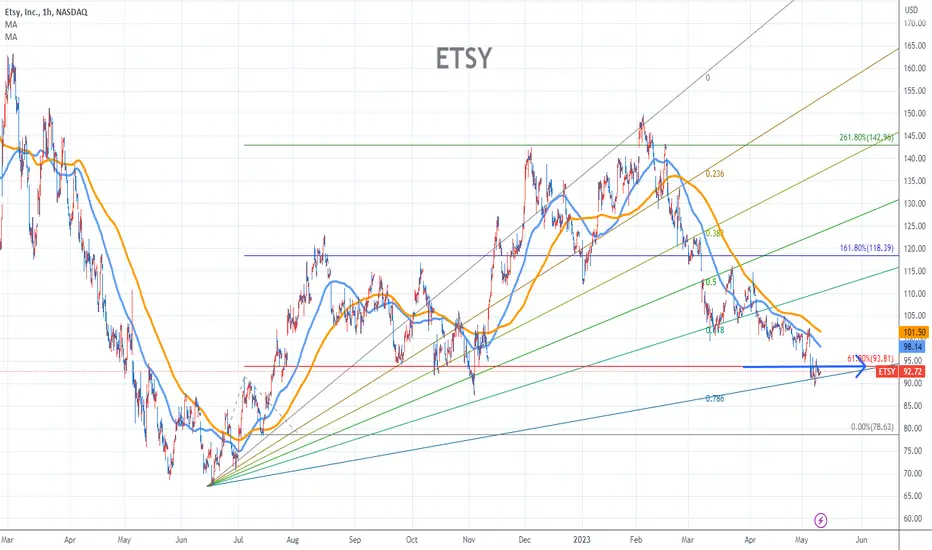
ETSY Stock Chart Fibonacci Analysis 050923Trading Idea
1) Find a FIBO slingshot
2) Check FIBO 61.80% level
3) Entry Point > 94/61.80%
CypherEarnings 5-3-23 AMC.
Cypher noted for now unless the 4th leg goes much further to the downside. The 4th leg is dashed as I am not sure it is complete.
Peak 2 is higher than peak 1. Leg 2 completed at the .618 of the first leg up. It is an M pattern.
This is not a long entry level although there was a attempt, but an throwback sent this back to support.
Etsy missed earning the last 2 quarters.
No recommendation.
possible stop under 99.23
IT APPEARS EARNINGS WILL BREAK OR MAKE THIS ONE.

ETSY - UpdateYellow count is primary with blue just behind... white has almost left the building but is still holding passes for divergences to arise. Daily bearish engulfing spells trouble and if a new low is found... don't fight the trend. GLTA!

Won't holdWe have a double top within another double top. This is very bearish, if price bounces off the weak support to test the resistance again I would add to my short position.

MOMO to $116?$ETSY really setting up here and can fly.
I think $SPY can hit 410 before cooling and in that move $ESTY can move a bit harder and hit a nice price.
Good luck

Who doesnt want to see a higher high?Looking to take up a swing position into ETSY. I dont know that this price target will be fully met. it is a fib retracement level that was left hanging, and it appears a leg up could be in order. Assuming we dont lose support as it sits at a key level and also at near the 200EMA.

ETSY LongI would wait for FOMC before any long trades but here is a stock to watch for swing long vs last week's low.

ETSY - 3 DazeThis market can be dizzy and confusing, but candles can light the way. ETSY has been on a rollercoaster of a ride as of late, but over the past few days, it has begun to change its normal mode of transportation. I'm not suggesting it will board a rocket ship any time soon, maybe never, but it does seem to have gathered up enough scratch over the past few months to ride in style for a lil while. The road map is there, and this crafty thing likes a good stencil. 3 day candle closes tomorrow, and if it remains as is (bullish engulfing) or stronger, then the beginnings of a cruise to 180 town can become the primary plan; lose this bullish engulfing look by tomorrow's close and vacation time could be canceled. GLTA!
