VZ Price Should Gravitate Towards Diluted EPS UptrendAn uptrend in diluted EPS (earnings per share) is overlaid on top of price and is indicated by the teal trend channel which price also follows. Price has dropped outside of this channel and can be considered out of place, needing to rise to get back in line with actual company performance.
Auxiliary arguments:
Price is at bottom of long-term price range.
PE ratio is at bottom of long-term range, excluding low period in 2018
Volume profile going back to 1996 shows air pocket below current price level
5.76% dividend yield
Price is at 200-month sma
Trade thoughts:
Timing has not been considered so this is not an options play.
Buy shares around $44 with a stop at $39.60 and price target of $60.99 for an intermediate-term (1-3 months maybe) swing trade or hold on as an investment.
BAC trade ideas

Verizon... is not in the zone. VZAnyway, we are shorting it.
Goals49. One only.
We are not in the business of getting every prediction right, no one ever does and that is not the aim of the game. The Fibonacci targets are highlighted in purple with invalidation in red. Fibonacci goals, it is prudent to suggest, are nothing more than mere fractally evident and therefore statistically likely levels that the market will go to. Having said that, the market will always do what it wants and always has a mind of its own. Therefore, none of this is financial advice, so do your own research and rely only on your own analysis. Trading is a true one man sport. Good luck out there and stay safe

VZ cup and handleBottom of handle for cup and handle on VZ. We are on the .5 fib for the monthly cup.

$VZ with a Neutral outlook following its earnings #Stocks The PEAD projected a Neutral outlook for $VZ after a Negative Under reaction following its earnings release placing the stock in drift D with an expected accuracy of 70%.

Long term double top on VZ, PT -10 (0) BankruptcyLong term double top on VZ, PT -10 (0). Pretty self explanatory.
Makes sense Verizon eventually dies out. Very inefficient, high management costs, dwindling growth, towers (aging tech). Nothing to offer over the very cheap carriers other than the brand name. Plus Google just started competing with them with much more efficient satellites. It seems very inevitable that this company is done. It's an empty bag.

28/6/2022 NYSE (VZ)Buy (Entry Price) above the black line and exit (Stop Loss) below the red line. Can take profit at the suggested Target Price.
Entry Price: $51.03
Target Price: $51.55
Stop Loss: $50.57

Verizon Communications VZ options ahead of EarningsLooking at the Verizon Communications VZ options chain today, i would buy the $45 puts with
2022-9-16 expiration date for about
$0.33 premium.
Looking forward to read your opinion about it.

Verizon awarded over $400M modernization contract with FBIVZ: Verizon Sourcing LLC
2022-07-19 08:30:00
Verizon awarded over $400M modernization contract with FBI

Short $VZ from 52,75Approaching resistance trend line that have held up 3 times. Will it hold for a 4th time?
Entry: 52,75
SL: 54,25
TP: 46,41

VZ a safe place to park money while collecting a nice dividendsNo fed pumping in 2021. Spent much of 2021 in a downtrend while exceeding earnings expectations. In 2022 PE ratios will fall making VZ P/E ratio 10 attractive. Expect its April started uptrend to continue until large cap overall P/E comes down.

VZ - Dominant Trend LineVerizon has a dominant trend line in green
A have included a few chart patterns
I expect bullish continuation as indicated by the double curve above the green line

Verizon: High Div Yield vs CG Loss?Verizon Communications Inc
Short Term - We look to Sell at 50.20 (stop at 51.90)
A sequence of weekly lower lows and highs has been posted. We can see no technical reason for a change of trend. 50 4hour EMA is at 50.38. We expect a significant move lower if prices manage to break the 50.38 support. Further downside is expected.
Our profit targets will be 46.05 and 45.00
Resistance: 52.00 / 55.53 / 59.80
Support: 46.00 / 42.80 / 38
Please be advised that the information presented on TradingView is provided to Vantage (‘Vantage Global Limited’, ‘we’) by a third-party provider (‘Signal Centre’) . Please be reminded that you are solely responsible for the trading decisions on your account. There is a very high degree of risk involved in trading. Any information and/or content is intended entirely for research, educational and informational purposes only and does not constitute investment or consultation advice or investment strategy. The information is not tailored to the investment needs of any specific person and therefore does not involve a consideration of any of the investment objectives, financial situation or needs of any viewer that may receive it. Kindly also note that past performance is not a reliable indicator of future results. Actual results may differ materially from those anticipated in forward-looking or past performance statements. We assume no liability as to the accuracy or completeness of any of the information and/or content provided herein and the Company cannot be held responsible for any omission, mistake nor for any loss or damage including without limitation to any loss of profit which may arise from reliance on any information supplied by Signal Centre.

MOVE UP?If you been following VZ stock for the past week or so you have notice on Friday that while most of the market was going up (VIX was falling) VZ had a big candle to the downside.
Towards the middle of the trading day VZ rejected up from the middle line of the uptrend channel (38.2 fib line ) and started to move sideways on 1H time frame.
Where will VZ go on Monday, up or down?
Look at the last daily candle, look at the amount of support right below it:
20MA (white line), 50MA (green line), rejected to $50.86 support (yellow) line (you can see multiple bounces to the upside from that line in the past, please zoom out to see it clearly)
VZ is also sitting right above downtrend middle line and above uptrend middle line which can act as support as well.
I do not know where it will go on Monday, but it sure will have a hard time breaking those support lines , but if it will then the next stop will be somewhere on the bottom of the uptrend channel.
Please take a look at the screen shot below for better view.

How Far will Verizon continue to DROP?Technical Analysis on Verizon Communications
Was it the right choice to add more shares to my portfolio?
Fundamentally it makes totally sense for me to own the stock. The numbers speak for themselves.
If we start viewing the stock from a technical point of view, then it's getting interesting and I can understand why many people say they keep their hands off it and wait.
So basically the stock recently took out the massive low that got created in 2020 during the huge sell of in the pandemic. So overall the price continued to be bearish and it will be bearish until we break the recent high.
I view the current pricing as a great opportunity to add more shares to my portfolio as it pays an incredible dividend at the current pricing value.
Hopefully, we can see the bulls getting back in control in the future but until then we are gonna be reactive, not predictive.

VZ Potential Short Coming Potential Short on $VZ incoming. Currently waiting for price to react to supply zone. Wait for correction and momentum shift. No play for no just watching.


$VZ reclaimed 1D Lin Reg Channel with MACD Converging...$VZ reclaimed 1D Lin Reg Support @ MCAD Converging.

Short scalp VZBased on its downtrend, regress off resistance and a familiar chart pattern confirmed by my technical indicators, I expect at least half a percent in profits IF VZ breaches yesterday's low of $47.77 during today's session.

Verizon is at the Bottom of Channel and the PCZ of a Bullish BatVerizon is certainly one to keep an eye on as it is at the Demand Zone of an Equidistant Channel that happens to be Confluent with a PCZ of a Bullish Bat Harmonic; I'v been watching and waiting a long time for it it for this Confluence Zone to be hit and now that it has i'v just bought 500 shares and am ready to take my chances here.

VZ retest of structure incoming!VZ being a failing there is no surprise for this chart pattern. VZ has shot below its Low price target for the year and We are seeing a very oversold VZ using our indicators and by looking at MA’s. Verizon will make a slight correction back up on the retest, but once this correction is over the VZ run will quickly end. The stock could fall to low to 40s or even lower.

$VZ with a Neutral outlook following its earnings #Stocks The PEAD projected a Neutral outlook for $VZ after a Negative Under reaction following its earnings release placing the stock in drift D with an expected accuracy of 75%.

VERIZON Forecast Entry 53.70 for that the closest strike is 54 target is 54.70 this idea is also designed for just regular holding

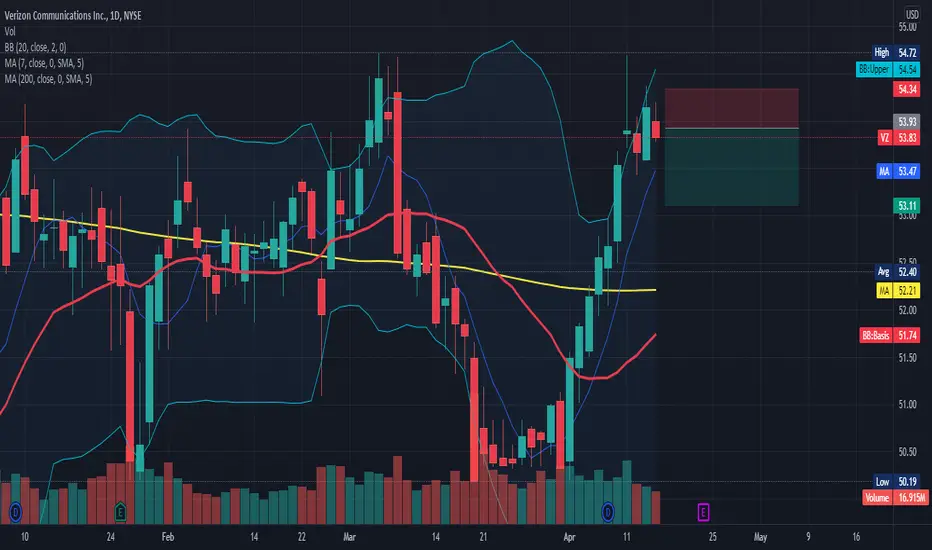
VERIZON, Intraday Strategy, Pivot point (PP) $53.93Hey there, if you are waiting for selling, this could be an interesting strategy, considering the pivot point ( PP ), support (S1,S2,S3), and resistances (R1,R2,R3).
For the next 2 days, we migth have a downward. Let's take a look at these band's results, Intraday strategy.
Target S1 $53.68 until S2 $53.52, controlling the stop loss at R1 $54.09 or R2 $54.34
R3 54.75
R2 54.34
R1 54.09
PP 53.93
S1 53.68
S2 53.52
S3 53.11