EDC trade ideas


Principle of PolarityED has strongly obeyed this principle over the years!
RSI is yet to determine a "bias".


Update on EDNice bounce of the bottom in the up-channel for ED. Higher low indicating another bullish move. Bulls have recaptured momentum on the hourly and 2hr but its still too early to confirm bullish divergence on the daily. A cross of the 7SMA and 14SMA would indicate safer entry point. Target at 1 Fib Extension.

Potential to go long on EDStochastic will be the first to indicate a long position and the EW oscillator will follow

$ED Short PositionFor the public record -- I took a short position on $ED yesterday at $94.71
I posted the trade to the Stocks and Indexes forum:
www.tradingview.com
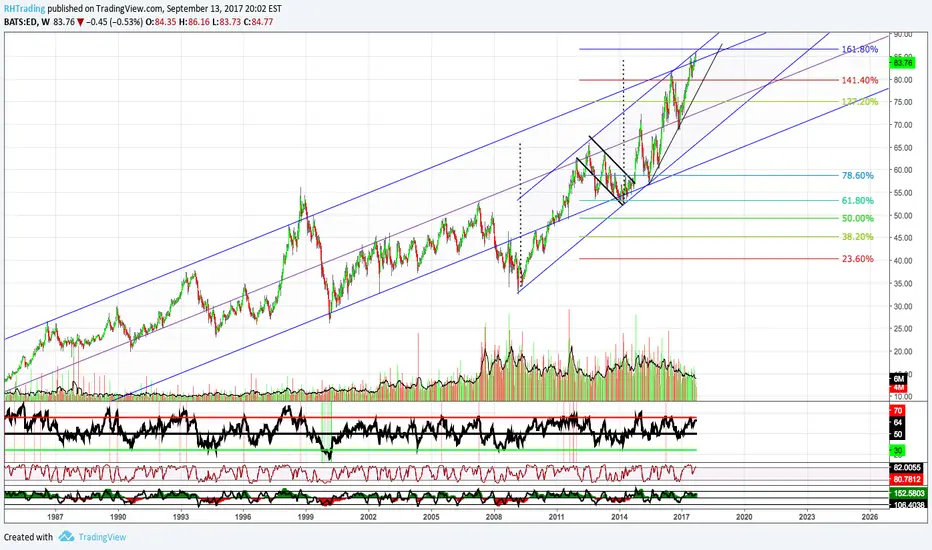
My reasons for shorting are technical, and not sociopolitical, but are too complex to describe on one chart, so I'll not attempt to do so. I will say that technical divergences were apparent to me at the time of the trade, and now, there is confirmation of the channel breakdown as can be seen in the attached image.
My opinions and actions are not recommendations to buy or sell any stock, bond, ETF , commodity, or any other financial instrument.

Longterm Long position, short term put opportunityLong term stock continues up trend, stock will create a put opportunity in the near future

ED 7 RRR shortReposting this since TV removed this idea earlier for containing links to my telegram group.
Trading Methodology:
1. An asymmetric bullish/bearish pennant is drawn using ascending and descending curved trend lines with a minimum of three price action touche points per line. The direction is determined by the previous trend.
2. The angle tool is applied from the earliest two trend touch points, beginning at the earliest touch point.
3. A trend-based Fibonacci retracement triangle is drawn starting from the earliest trend touch point and ending at the earliest touch point of the opposite trend line .
4. Based on the degree, of the earlier defined angle, the appropriate (and secret) levels are selected for the fibonacci retracement ; two levels for stop-loss and two levels for take-profit. The closest stop-loss level to the current price level is the top priority stop-loss. Though the secondary stop-loss level is often chosen for some markets such as FX and some equities in order to account for seldom unexpected resistance breaks. The greater target level is the top priority, and where majority of the shares are sold, though some may choose to close part of the position at the first target level or set it to be the stop-loss once price exceeds it. Entries should be laddered in around the levels closest of the yellow line.
This trading strategy can be applied to any market and time frame, and positions most often garner the greatest risk-to-reward ratio with the highest success rate. What more can you ask for? I will only be posting my unique trading strategy until EOY. I work solely with price action to identify pennants and apply unique trend-based fibonacci retracement levels for SL and TP levels. Reach out to me if you have any questions.

$ED - Daily&Weekly chart. In Bullish Breakout?! #StocksNice move today! Potential Bullish breakout + H&S Inverted! above 80,70 potential PT 84,7$ then 86$. Good Vol. Stop Zone under 79$.
Stay Tuned!


S&P 500 Dividend Aristocrats Weekly Chart: (ED)Long Term Trend Following. Likely a decent short in the coming weeks.
ed waiting for pullback utilities sector looking strong
daily timeframe shows positive trend strength and rising MA's
intermediate shows rising MA's with Short term MA slightly weakening
looking for pullback into support area of 81.00 area and bounce back to 81.60 area for a retest of resistance
obv showing positive volume pressure
Short term MA and VWAP working as dynamic resistance and looking for entry down at support


Smashed through support second short target very possible...All reqts met, we're headed lower - but how much lower?

"CAUTION" CON ED APPROACHING LONG TERM BALANCE TARGETSCON ED ...LONG TERM TARGETS AT 81 -85
NOT CALLING THE END OF THE TREND BUT
BE VERY CAUTIOUS...PRICE ACTION TELLS
THE INTENT


"ED" LOSING POWER SLOWLYCON -ED...3 DRIVE POTENTIAL PATTERN AT THE HIGH.
CAUTION....
TRADE PLACEMENT ALONG WITH "TIME" IS EVERYTHING

The Case for USA Electric Utilities, even with Rising USA RatesRunning Alpha Capital Markets observes that higher rates are not always a headwind, as the not too distant record shows that the electric utilities group can outperform and offer a margin of safety.
During the last period of higher rates, from mid 2004 to mid-2006, the FOMC hiked rates 16 times, and despite these incremental actions, electric utilities actually outperformed the broad USA equity market indices by a fairly wide margin.
The electrics don't start to significantly under-perform until the Fed funds rate passes the yield of the average electric utility stock; and we will be no where near there even after a number of measured hikes.
Absolute returns on electric utilities are likely to stay rich, regardless of what interest rates do over the next market cycle.
Looking at the average electric utility investor, who are the buy and hold type of market actor, we still have good electric utility yields out there relative to what the Treasuries offer, and on top of that, the electric utilities have attractive balance sheets with good dividend growth and compelling absolute total returns.


$ED is now 92.09. Price Target Hit. Great HPS setup.$ED is now 92.09. Price Target Hit. Great HPS setup. (High Probability Setup)

ED counter-trend potentially extinct Self explanatory.. Utilities/Defense component, on watch although weekly buy-swing is getting a tad hot.. Like the MACD cross
