Royal Caribbean approaching rough seas?The consensus view strongly indicates that Royal Caribbean presents an unfavorable risk-reward profile at current valuation levels. Despite impressive operational recovery metrics including 69.5% net income growth and 73.4% diluted EPS growth in FY2024, the stock's valuation appears disconnected fro
Royal Caribbean Group
No trades
Key facts today
Next report date
—
Report period
—
EPS estimate
—
Revenue estimate
—
12.80 EUR
2.78 B EUR
15.92 B EUR
253.51 M
About Royal Caribbean Cruises Ltd.
Sector
Industry
CEO
Jason T. Liberty
Website
Headquarters
Miami
Founded
1968
ISIN
LR0008862868
FIGI
BBG000BRFML9
Royal Caribbean Group is a cruise company, which engages in the ownership and operation of the following global cruise brands: Royal Caribbean International, Celebrity Cruises, and Silversea Cruises. The firm also holds interest in TUI Cruises GmbH, which operates the German brands TUI Cruises and Hapag-Lloyd Cruises. The company was founded by Arne Wilhelmsen in 1968 and is headquartered in Miami, FL.
Related stocks

A cyclical long idea for a travel cruiseThe main long cyclical idea came after I remembered what happened to cruise companies in the pandemic era that generated a bear market for them, but now I have to say the market has been regaining their up cyclical trend.

Royal Caribbean Cruises BUYRoyal Caribbean is a top beneficiary of the post-pandemic travel boom. Record bookings in cruises and leisure travel have driven exceptional earnings results and bullish sentiment.

Royal Caribbean Cruises — Double Top Signals Rough Seas AheadPrice action in Alliant Energy has developed a clear double-top reversal pattern , with the neckline now broken on strong momentum. This structure signals exhaustion of the prior uptrend and the possibility of a bearish leg unfolding.
Adding further conviction, the MACD indicator has printed a

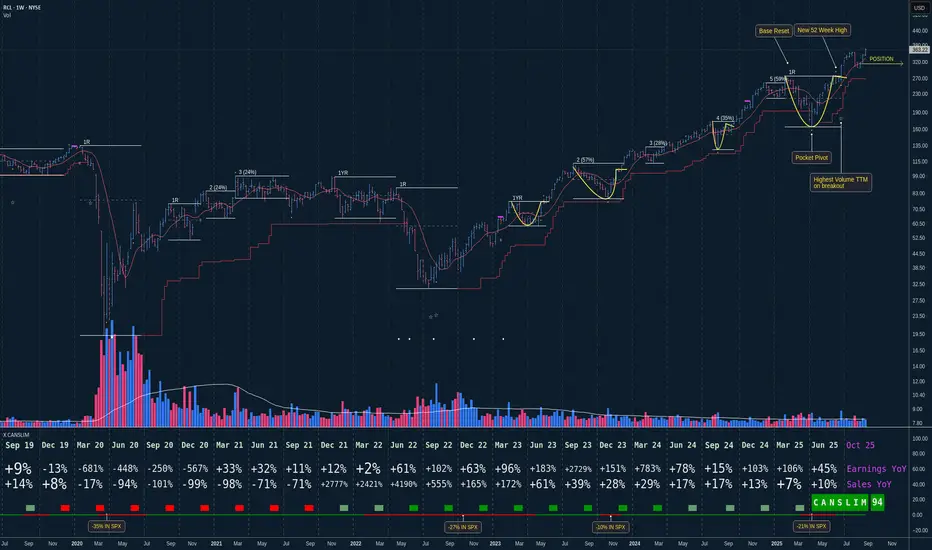
RCL clearing a Cup with HandleWe maybe are at the start of the next leg up in RCL !
Key points:
1. Fundamentals are good with a strong RS Rating of 94 right now.
2. We are at a new Market cycle since June 25.
3. We are at an early Base 1 just after a reset.
4. Pocket Pivot at the base low.
5. Last base draw a Cup with Handle
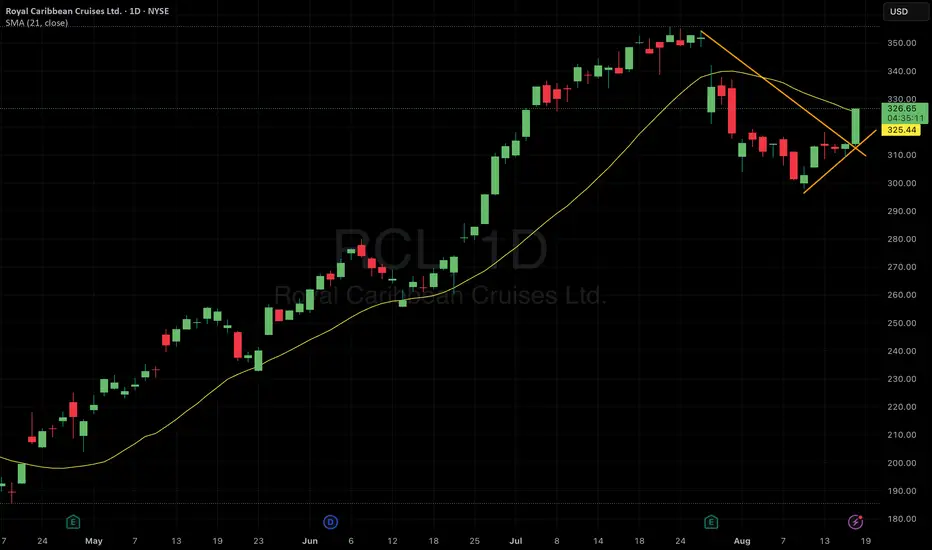
RCL Starting a BreakoutNYSE:RCL starting to do what it does, break out.... starting a new uptrend...
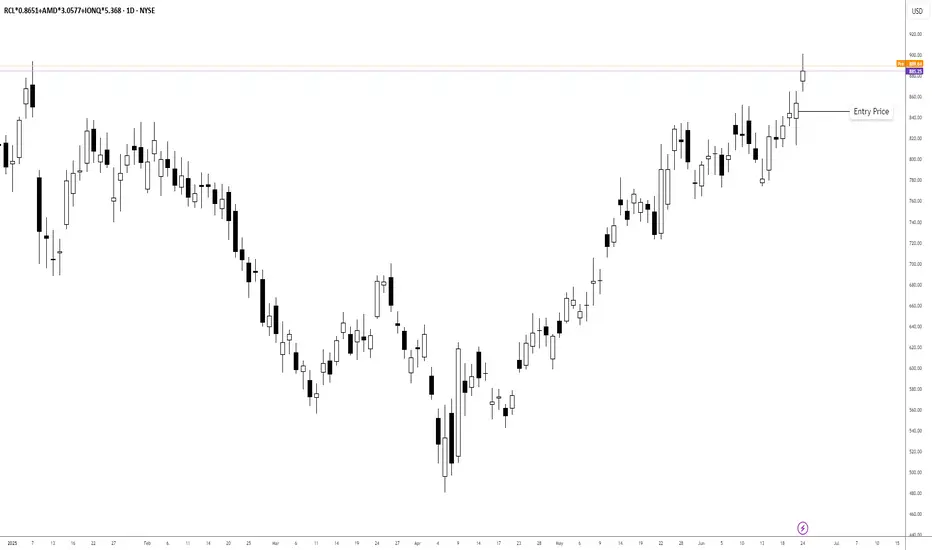
2025/06/24 Portfolio BalanceAdvanced Micro Devices, Inc. (XNAS:AMD):
Current Value: $423.28
Current Price: $138.43 (6.39% daily change)
Quantity: 3.0577
Purchase Date: April 23, 2025
Purchase Price: $129.51
Purchase Value: $396.00
Total Change: 6.89%
Royal Caribbean Cruises Ltd. (XNYS:RCL):
Current Value: $242.63
Current Pric
SHORT $RCL | Recession UnderwayRoyal Caribbean bailout cash drying up.
This chart is a good indication of current economic weakness.
I am looking for NYSE:RCL to drop 60% - 80% from the all time high.
I will continue to monitor and provide updates.
God bless!

RCL Eiffel Tower CAUTION! UPDATERCL is in a very capital-heavy industry that is very economically sensitive.
I first published this Idea back on February 11, 2025. Since then, it has dropped over -40%.
Normally, I would say that from erections come corrections. However, this has the Eiffel Tower structure in place for a full-on

RCL Eiffel Tower CAUTION!RCL is in a very capital-heavy industry that is very economically sensitive.
Normally I would say from erections some corrections. However this has the Eiffel Tower structure in place for a full-on reversal. That remains to be seen. For now, we look for at least a correction and go from there.
Ca

See all ideas
Summarizing what the indicators are suggesting.
Neutral
SellBuy
Strong sellStrong buy
Strong sellSellNeutralBuyStrong buy
Neutral
SellBuy
Strong sellStrong buy
Strong sellSellNeutralBuyStrong buy
Neutral
SellBuy
Strong sellStrong buy
Strong sellSellNeutralBuyStrong buy
An aggregate view of professional's ratings.
Neutral
SellBuy
Strong sellStrong buy
Strong sellSellNeutralBuyStrong buy
Neutral
SellBuy
Strong sellStrong buy
Strong sellSellNeutralBuyStrong buy
Neutral
SellBuy
Strong sellStrong buy
Strong sellSellNeutralBuyStrong buy
Displays a symbol's price movements over previous years to identify recurring trends.
RCL5759105
Royal Caribbean Cruises Ltd. 6.25% 15-MAR-2032Yield to maturity
6.32%
Maturity date
Mar 15, 2032
USV7780TAP8
Royal Caribbean Cruises Ltd. 6.0% 01-FEB-2033Yield to maturity
5.63%
Maturity date
Feb 1, 2033
RCL5239261
Royal Caribbean Cruises Ltd. 5.5% 31-AUG-2026Yield to maturity
5.36%
Maturity date
Aug 31, 2026
RCL6183501
Royal Caribbean Cruises Ltd. 5.375% 15-JAN-2036Yield to maturity
5.30%
Maturity date
Jan 15, 2036
RCL5759106
Royal Caribbean Cruises Ltd. 6.25% 15-MAR-2032Yield to maturity
5.29%
Maturity date
Mar 15, 2032
RCL5894476
Royal Caribbean Cruises Ltd. 5.625% 30-SEP-2031Yield to maturity
5.17%
Maturity date
Sep 30, 2031
RC8B
Royal Caribbean Cruises Ltd. 5.5% 01-APR-2028Yield to maturity
5.00%
Maturity date
Apr 1, 2028
RCL5334490
Royal Caribbean Cruises Ltd. 5.375% 15-JUL-2027Yield to maturity
4.82%
Maturity date
Jul 15, 2027
RCL5155641
Royal Caribbean Cruises Ltd. 5.5% 01-APR-2028Yield to maturity
4.75%
Maturity date
Apr 1, 2028
USV7780TAF0
Royal Caribbean Cruises Ltd. 4.25% 01-JUL-2026Yield to maturity
4.73%
Maturity date
Jul 1, 2026
US780153AG7
Royal Caribbean Cruises Ltd. 7.5% 15-OCT-2027Yield to maturity
4.57%
Maturity date
Oct 15, 2027
See all RC8 bonds
Curated watchlists where RC8 is featured.


Frequently Asked Questions
Depending on the exchange, the stock ticker may vary. For instance, on FWB exchange Royal Caribbean Group stocks are traded under the ticker RC8.
We've gathered analysts' opinions on Royal Caribbean Group future price: according to them, RC8 price has a max estimate of 343.76 EUR and a min estimate of 236.34 EUR. Watch RC8 chart and read a more detailed Royal Caribbean Group stock forecast: see what analysts think of Royal Caribbean Group and suggest that you do with its stocks.
RC8 stock is 2.45% volatile and has beta coefficient of 1.65. Track Royal Caribbean Group stock price on the chart and check out the list of the most volatile stocks — is Royal Caribbean Group there?
Today Royal Caribbean Group has the market capitalization of 57.91 B, it has decreased by −6.23% over the last week.
Yes, you can track Royal Caribbean Group financials in yearly and quarterly reports right on TradingView.
Royal Caribbean Group is going to release the next earnings report on Jan 29, 2026. Keep track of upcoming events with our Earnings Calendar.
RC8 earnings for the last quarter are 4.90 EUR per share, whereas the estimation was 4.85 EUR resulting in a 1.10% surprise. The estimated earnings for the next quarter are 2.38 EUR per share. See more details about Royal Caribbean Group earnings.
Royal Caribbean Group revenue for the last quarter amounts to 4.38 B EUR, despite the estimated figure of 4.40 B EUR. In the next quarter, revenue is expected to reach 3.65 B EUR.
RC8 net income for the last quarter is 1.34 B EUR, while the quarter before that showed 1.03 B EUR of net income which accounts for 30.78% change. Track more Royal Caribbean Group financial stats to get the full picture.
Yes, RC8 dividends are paid quarterly. The last dividend per share was 0.86 EUR. As of today, Dividend Yield (TTM)% is 1.23%. Tracking Royal Caribbean Group dividends might help you take more informed decisions.
Royal Caribbean Group dividend yield was 0.41% in 2024, and payout ratio reached 8.68%. The year before the numbers were 0.00% and 0.00% correspondingly. See high-dividend stocks and find more opportunities for your portfolio.
As of Dec 11, 2025, the company has 106 K employees. See our rating of the largest employees — is Royal Caribbean Group on this list?
EBITDA measures a company's operating performance, its growth signifies an improvement in the efficiency of a company. Royal Caribbean Group EBITDA is 5.36 B EUR, and current EBITDA margin is 34.65%. See more stats in Royal Caribbean Group financial statements.
Like other stocks, RC8 shares are traded on stock exchanges, e.g. Nasdaq, Nyse, Euronext, and the easiest way to buy them is through an online stock broker. To do this, you need to open an account and follow a broker's procedures, then start trading. You can trade Royal Caribbean Group stock right from TradingView charts — choose your broker and connect to your account.
Investing in stocks requires a comprehensive research: you should carefully study all the available data, e.g. company's financials, related news, and its technical analysis. So Royal Caribbean Group technincal analysis shows the sell today, and its 1 week rating is sell. Since market conditions are prone to changes, it's worth looking a bit further into the future — according to the 1 month rating Royal Caribbean Group stock shows the buy signal. See more of Royal Caribbean Group technicals for a more comprehensive analysis.
If you're still not sure, try looking for inspiration in our curated watchlists.
If you're still not sure, try looking for inspiration in our curated watchlists.