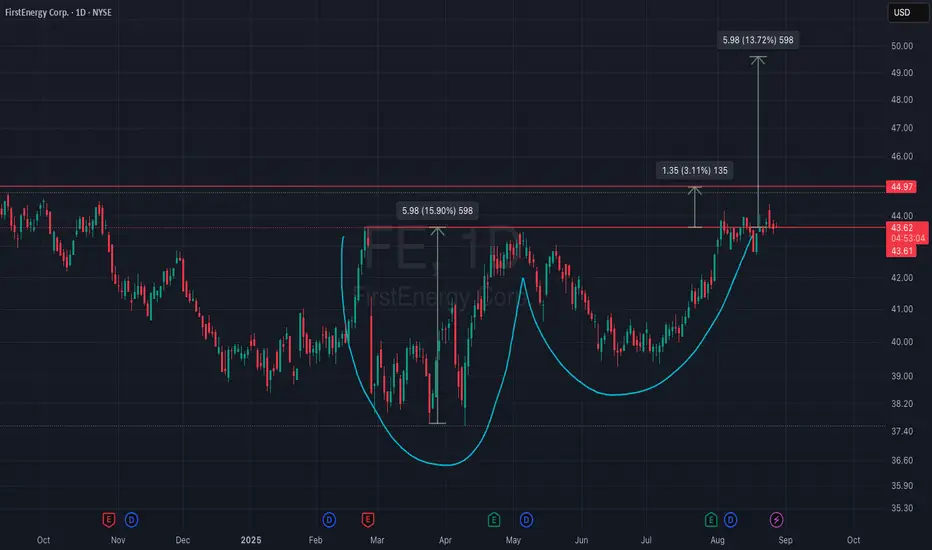
FirstEnergy Corp. (FE) – Cup & Handle at Key Breakout ZoneFirstEnergy (FE) is displaying a cup & handle formation on the daily chart, with resistance sitting at the $44.90–45.00 zone. Price is consolidating right below this neckline, preparing for a potential breakout.
A breakout above this level could unlock significant upside momentum with measured move
Next report date
—
Report period
—
EPS estimate
—
Revenue estimate
—
1.96 EUR
944.73 M EUR
13.01 B EUR
576.68 M
About FirstEnergy Corp.
Sector
Industry
CEO
Brian X. Tierney
Website
Headquarters
Akron
Founded
1996
ISIN
US3379321074
FIGI
BBG00Z0WZQ87
FirstEnergy Corp. engages in the generation, transmission, and distribution of electricity, energy management and other energy-related services through its subsidiaries. It operates through the following business segments: Regulated Distribution, Regulated Transmission, and Corporate or Other. The Regulated Distribution segment distributes electricity through FirstEnergy's utility operating companies, serving various customers. The Regulated Transmission segment transmits electricity through transmission facilities owned and operated by FirstEnergy's utilities. The Corporate or Other segment reflects corporate support and other costs not charged or attributable to the utilities or transmission companies. The company was founded in 1996 and is headquartered in Akron, OH.
Related stocks
$FEGreen: Entry Point
Blue: Start of Week
Red: End of Week
Thumbs Up: Trade Available for Week
Numbers: Price Targets
*For share traders only. Not meant for options.

Watchlist: FEFE added to my watchlist. I got a setup signal(1) and with above average volume(2). Looking to enter long near the close of the day if the stock can manage to close above the last candle highs(3) with a stop-loss below (4) and a price target above(5).
= = = =
"A little progress each day adds up to

$FE with a Bullish outlook following its earnings #Stocks The PEAD projected a Bullish outlook for $FE after a Positive over reaction following its earnings release placing the stock in drift B with an expected accuracy of 33.33%.

$FE with a Bullish outlook following its earnings #Stocks The PEAD projected a Bullish outlook for $FE after a Positive Under reaction following its earnings release placing the stock in drift A with an expected accuracy of 83.33%.

FE - Daily ScenariosPrice has seen a nice break out from a falling wedge on this daily timeframe , which has led to a bigger double top
Right now price is completing this double top pattern
I have placed double curve lines for where I think price will possibly recover, one on the middle Channel line and one a little lo


$FE First Energy#$FE is a utility stock. Boring to trade.
Dividend .36 *4 = $1.56 per year
Now near 200 days. Multiple times last few days as seen in chart.
Oscillator 5,35 divergence.
So possible entry 41.8 levels SL 41
It is one of the few stocks i make $ regularly.
Entry price is important in this stock.


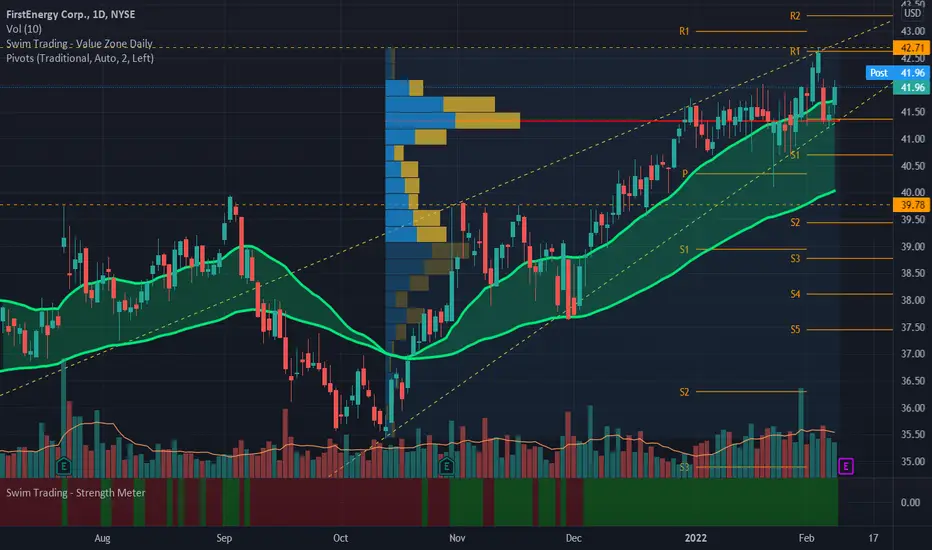
FE.NYS_Swim Trading VZ Breakout_LongENTRY: 41.68
SL: 39.93
TP1: 43.56
TP2: 44.85
- ADX<20. Would like to be higher.
- Maintaining at pivot point "P" and HVN level.
- Strength meter is green hence some strength.
- Broke out of VZ previously on 3 Feb 2022.
- Watch for earnings on 10 Feb 2022.
- Entry based on breakout again from VZ tod
See all ideas
Summarizing what the indicators are suggesting.
Neutral
SellBuy
Strong sellStrong buy
Strong sellSellNeutralBuyStrong buy
Neutral
SellBuy
Strong sellStrong buy
Strong sellSellNeutralBuyStrong buy
Neutral
SellBuy
Strong sellStrong buy
Strong sellSellNeutralBuyStrong buy
An aggregate view of professional's ratings.
Neutral
SellBuy
Strong sellStrong buy
Strong sellSellNeutralBuyStrong buy
Neutral
SellBuy
Strong sellStrong buy
Strong sellSellNeutralBuyStrong buy
Neutral
SellBuy
Strong sellStrong buy
Strong sellSellNeutralBuyStrong buy
Displays a symbol's price movements over previous years to identify recurring trends.
M
FE5651417
Monongahela Power Company 5.85% 15-FEB-2034Yield to maturity
5.30%
Maturity date
Feb 15, 2034
J
FE.LM
Jersey Central Power & Light Company 6.15% 01-JUN-2037Yield to maturity
5.24%
Maturity date
Jun 1, 2037
C
FE.LD
Cleveland Electric Illuminating Company 5.95% 15-DEC-2036Yield to maturity
5.23%
Maturity date
Dec 15, 2036
J
FE.LC
Jersey Central Power & Light Company 6.4% 15-MAY-2036Yield to maturity
5.06%
Maturity date
May 15, 2036
See all FE7 bonds
Frequently Asked Questions
The current price of FE7 is 40.40 EUR — it has increased by 0.50% in the past 24 hours. Watch FirstEnergy Corp. stock price performance more closely on the chart.
Depending on the exchange, the stock ticker may vary. For instance, on GETTEX exchange FirstEnergy Corp. stocks are traded under the ticker FE7.
FE7 stock has risen by 1.51% compared to the previous week, the last month showed zero change in price, over the last year FirstEnergy Corp. has showed a 3.06% increase.
We've gathered analysts' opinions on FirstEnergy Corp. future price: according to them, FE7 price has a max estimate of 46.37 EUR and a min estimate of 40.36 EUR. Watch FE7 chart and read a more detailed FirstEnergy Corp. stock forecast: see what analysts think of FirstEnergy Corp. and suggest that you do with its stocks.
FE7 stock is 1.51% volatile and has beta coefficient of 0.09. Track FirstEnergy Corp. stock price on the chart and check out the list of the most volatile stocks — is FirstEnergy Corp. there?
Today FirstEnergy Corp. has the market capitalization of 23.15 B, it has decreased by −0.98% over the last week.
Yes, you can track FirstEnergy Corp. financials in yearly and quarterly reports right on TradingView.
FirstEnergy Corp. is going to release the next earnings report on Feb 5, 2026. Keep track of upcoming events with our Earnings Calendar.
FE7 earnings for the last quarter are 0.71 EUR per share, whereas the estimation was 0.63 EUR resulting in a 11.99% surprise. The estimated earnings for the next quarter are 0.50 EUR per share. See more details about FirstEnergy Corp. earnings.
FirstEnergy Corp. revenue for the last quarter amounts to 3.49 B EUR, despite the estimated figure of 3.31 B EUR. In the next quarter, revenue is expected to reach 2.79 B EUR.
FE7 net income for the last quarter is 375.82 M EUR, while the quarter before that showed 227.51 M EUR of net income which accounts for 65.19% change. Track more FirstEnergy Corp. financial stats to get the full picture.
Yes, FE7 dividends are paid quarterly. The last dividend per share was 0.38 EUR. As of today, Dividend Yield (TTM)% is 3.76%. Tracking FirstEnergy Corp. dividends might help you take more informed decisions.
FirstEnergy Corp. dividend yield was 4.24% in 2024, and payout ratio reached 99.41%. The year before the numbers were 4.31% and 82.30% correspondingly. See high-dividend stocks and find more opportunities for your portfolio.
As of Nov 20, 2025, the company has 12.29 K employees. See our rating of the largest employees — is FirstEnergy Corp. on this list?
EBITDA measures a company's operating performance, its growth signifies an improvement in the efficiency of a company. FirstEnergy Corp. EBITDA is 3.79 B EUR, and current EBITDA margin is 27.65%. See more stats in FirstEnergy Corp. financial statements.
Like other stocks, FE7 shares are traded on stock exchanges, e.g. Nasdaq, Nyse, Euronext, and the easiest way to buy them is through an online stock broker. To do this, you need to open an account and follow a broker's procedures, then start trading. You can trade FirstEnergy Corp. stock right from TradingView charts — choose your broker and connect to your account.
Investing in stocks requires a comprehensive research: you should carefully study all the available data, e.g. company's financials, related news, and its technical analysis. So FirstEnergy Corp. technincal analysis shows the buy rating today, and its 1 week rating is strong buy. Since market conditions are prone to changes, it's worth looking a bit further into the future — according to the 1 month rating FirstEnergy Corp. stock shows the buy signal. See more of FirstEnergy Corp. technicals for a more comprehensive analysis.
If you're still not sure, try looking for inspiration in our curated watchlists.
If you're still not sure, try looking for inspiration in our curated watchlists.