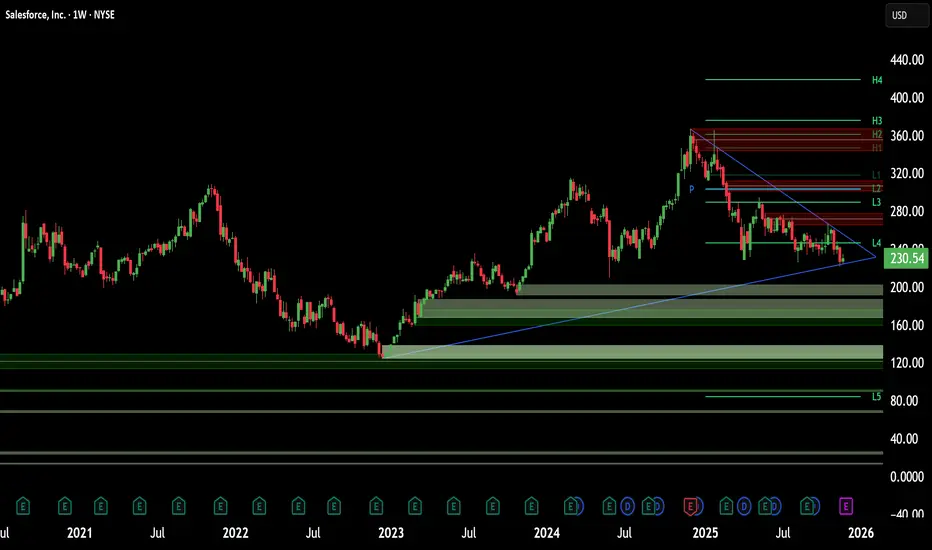
CRM - Minor Downtrend Line Broken!CRM - CURRENT PRICE : 260.57
CRM previously entered a downtrend following a double-top reversal , which pushed the stock into a prolonged bearish trend. However, current price action shows early signs of trend change as CRM successfully breaks above the minor downtrend line with strong momentum.
Salesforce, Inc.
No trades
Key facts today
Next report date
—
Report period
—
EPS estimate
—
Revenue estimate
—
6.55 EUR
5.98 B EUR
36.59 B EUR
927.03 M
About Salesforce, Inc.
Sector
Industry
CEO
Marc Russell Benioff
Website
Headquarters
San Francisco
Founded
1999
ISIN
US79466L3024
FIGI
BBG00FZMG7V2
Salesforce, Inc. engages in the design and development of cloud-based enterprise software for customer relationship management. Its solutions include sales force automation, customer service and support, marketing automation, digital commerce, community management, collaboration, industry-specific solutions, and salesforce platform. The firm also provides guidance, support, training, and advisory services. The company was founded by Marc Russell Benioff and Parker Harris in 1999 and is headquartered in San Francisco, CA.
Related stocks

Salesforce (NYSE: $CRM) Stock: Record Q3 & Breakout SetupSalesforce (NYSE: NYSE:CRM ) delivered a standout fiscal Q3 2026, posting record results driven by explosive growth in Agentforce and Data 360, its fastest-scaling AI and data platforms. Revenue rose 9% year-over-year to $10.3 billion, with subscription and support revenue reaching $9.7 billion, up

Salesforce’s AI Pivot: The Rise of the Agentic EnterpriseSalesforce (CRM) stands at a pivotal intersection of software legacy and artificial intelligence innovation. Despite a year-to-date stock correction of 32%, the company’s fundamentals tell a story of aggressive evolution. The cloud pioneer is systematically re-engineering its DNA to dominate the "Ag
Salesforce Inc. surges on earnings beat and AI growth storyCurrent Price: $260.57
Direction: LONG
Confidence Level: 78% (Strong institutional buying, multiple traders highlighting bullish setups despite some legal headwinds)
Targets:
- T1 = $268.00
- T2 = $272.50
Stop Levels:
- S1 = $256.00
- S2 = $252.50
**Wisdom of Professional Traders:**
The collec

CRM HIGH PROBABILITY LONG SETUP SOON!!!🚨 CRM HIGH PROBABILITY BUY SETUP 🚨
* Here We Can See Clearly The Next Potential Moves For CRM Coming Hours/Days.
* Keep Your Eyes Close On Your Trading Positions.
* Happy PIP Hunting Traders.
FXKILLA.

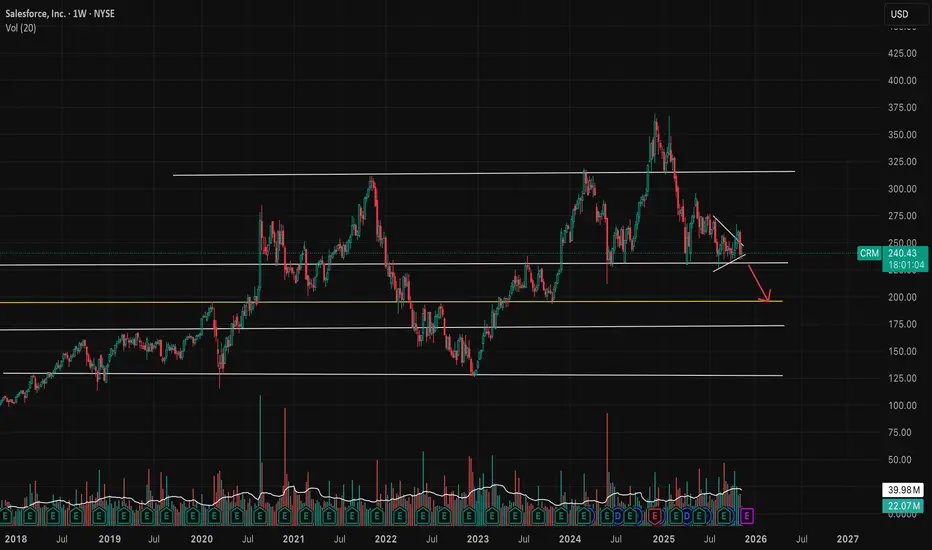
Bear flag on weekly chart, Further breakdown?- NYSE:CRM is forming bear flag on weekly chart.
- It could break down further and test some support underneath around $195
Quant Signals V3 CRM Call Setup: Riding Post-Earnings MomentumCRM QuantSignals V3 Earnings 2025-12-03
Signal Type: Earnings Trade
Direction: BUY CALLS (LONG)
Strike Price: $225.00
Entry Price: $16.33 (midpoint of $16.10–$16.55)
Profit Target 1: $24.50 (≈50% gain)
Profit Target 2: $32.66 (≈100% gain)
Stop Loss: $11.43 (≈30% risk)
Expiry: 2025-12-05 (2 days)
Pos
Salesforce for short-term upside after AI sector enthusiasm
Current Price: $226.15
Direction: LONG
Confidence Level: 58% (Limited but positive sentiment from professional traders; targets tight due to low supporting data volume)
Targets:
- T1 = $229.00
- T2 = $233.00
Stop Levels:
- S1 = $224.00
- S2 = $221.00
**Wisdom of Professional Traders:**
This a

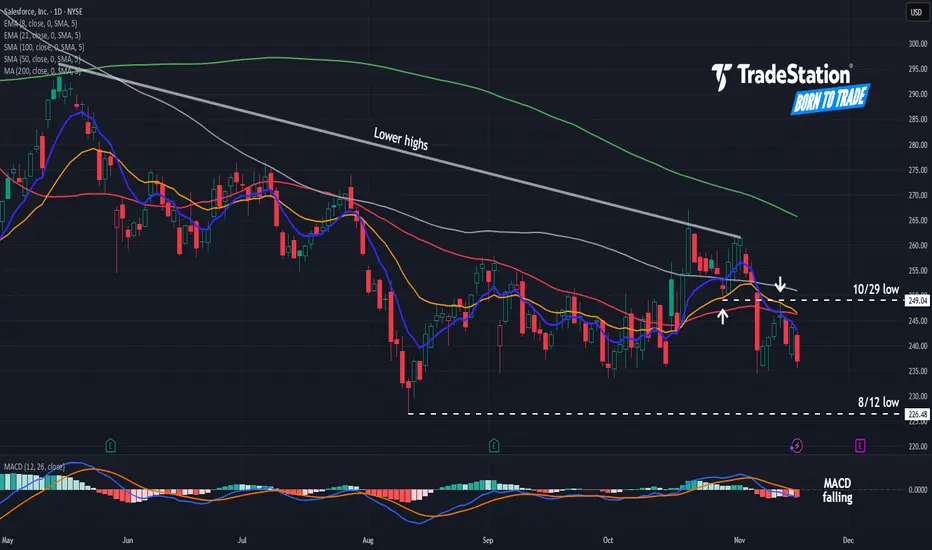
Salesforce May Be SlidingSalesforce has limped despite the broader market climbing. Now some traders may see risk of a bigger slide in the software company.
The first pattern on today’s chart is the series of lower highs since mid-May. That could suggest sellers outnumber buyers.
Second, the 50-day simple moving average
$CRM SALESFORCEA technical examination of Salesforce's ( NYSE:CRM ) price chart reveals a compelling and potentially decisive consolidation pattern currently in play. The prevailing structure points towards a bearish inclination, but it is also setting the stage for a significant breakout move in either direction.

See all ideas
Summarizing what the indicators are suggesting.
Neutral
SellBuy
Strong sellStrong buy
Strong sellSellNeutralBuyStrong buy
Neutral
SellBuy
Strong sellStrong buy
Strong sellSellNeutralBuyStrong buy
Neutral
SellBuy
Strong sellStrong buy
Strong sellSellNeutralBuyStrong buy
An aggregate view of professional's ratings.
Neutral
SellBuy
Strong sellStrong buy
Strong sellSellNeutralBuyStrong buy
Neutral
SellBuy
Strong sellStrong buy
Strong sellSellNeutralBuyStrong buy
Neutral
SellBuy
Strong sellStrong buy
Strong sellSellNeutralBuyStrong buy
Displays a symbol's price movements over previous years to identify recurring trends.
US79466LAL8
Salesforce, Inc. 2.9% 15-JUL-2051Yield to maturity
5.60%
Maturity date
Jul 15, 2051
US79466LAM6
Salesforce, Inc. 3.05% 15-JUL-2061Yield to maturity
5.58%
Maturity date
Jul 15, 2061
US79466LAK0
Salesforce, Inc. 2.7% 15-JUL-2041Yield to maturity
5.31%
Maturity date
Jul 15, 2041
US79466LAJ3
Salesforce, Inc. 1.95% 15-JUL-2031Yield to maturity
4.31%
Maturity date
Jul 15, 2031
US79466LAH7
Salesforce, Inc. 1.5% 15-JUL-2028Yield to maturity
3.89%
Maturity date
Jul 15, 2028
US79466LAF1
Salesforce, Inc. 3.7% 11-APR-2028Yield to maturity
3.87%
Maturity date
Apr 11, 2028
See all FOO bonds
Curated watchlists where FOO is featured.


Frequently Asked Questions
The current price of FOO is 225.80 EUR — it has decreased by −0.13% in the past 24 hours. Watch Salesforce, Inc. stock price performance more closely on the chart.
Depending on the exchange, the stock ticker may vary. For instance, on GETTEX exchange Salesforce, Inc. stocks are traded under the ticker FOO.
FOO stock has risen by 10.19% compared to the previous week, the month change is a 7.29% rise, over the last year Salesforce, Inc. has showed a −32.26% decrease.
We've gathered analysts' opinions on Salesforce, Inc. future price: according to them, FOO price has a max estimate of 348.06 EUR and a min estimate of 191.65 EUR. Watch FOO chart and read a more detailed Salesforce, Inc. stock forecast: see what analysts think of Salesforce, Inc. and suggest that you do with its stocks.
FOO stock is 1.16% volatile and has beta coefficient of 1.25. Track Salesforce, Inc. stock price on the chart and check out the list of the most volatile stocks — is Salesforce, Inc. there?
Today Salesforce, Inc. has the market capitalization of 210.36 B, it has increased by 10.45% over the last week.
Yes, you can track Salesforce, Inc. financials in yearly and quarterly reports right on TradingView.
Salesforce, Inc. is going to release the next earnings report on Mar 4, 2026. Keep track of upcoming events with our Earnings Calendar.
FOO earnings for the last quarter are 2.82 EUR per share, whereas the estimation was 2.48 EUR resulting in a 13.59% surprise. The estimated earnings for the next quarter are 2.62 EUR per share. See more details about Salesforce, Inc. earnings.
Salesforce, Inc. revenue for the last quarter amounts to 8.89 B EUR, despite the estimated figure of 8.91 B EUR. In the next quarter, revenue is expected to reach 9.62 B EUR.
FOO net income for the last quarter is 1.81 B EUR, while the quarter before that showed 1.65 B EUR of net income which accounts for 9.39% change. Track more Salesforce, Inc. financial stats to get the full picture.
Yes, FOO dividends are paid quarterly. The last dividend per share was 0.35 EUR. As of today, Dividend Yield (TTM)% is 0.63%. Tracking Salesforce, Inc. dividends might help you take more informed decisions.
Salesforce, Inc. dividend yield was 0.47% in 2024, and payout ratio reached 25.15%. The year before the numbers were 0.00% and 0.00% correspondingly. See high-dividend stocks and find more opportunities for your portfolio.
As of Dec 10, 2025, the company has 76.45 K employees. See our rating of the largest employees — is Salesforce, Inc. on this list?
EBITDA measures a company's operating performance, its growth signifies an improvement in the efficiency of a company. Salesforce, Inc. EBITDA is 12.51 B EUR, and current EBITDA margin is 34.93%. See more stats in Salesforce, Inc. financial statements.
Like other stocks, FOO shares are traded on stock exchanges, e.g. Nasdaq, Nyse, Euronext, and the easiest way to buy them is through an online stock broker. To do this, you need to open an account and follow a broker's procedures, then start trading. You can trade Salesforce, Inc. stock right from TradingView charts — choose your broker and connect to your account.
Investing in stocks requires a comprehensive research: you should carefully study all the available data, e.g. company's financials, related news, and its technical analysis. So Salesforce, Inc. technincal analysis shows the buy rating today, and its 1 week rating is buy. Since market conditions are prone to changes, it's worth looking a bit further into the future — according to the 1 month rating Salesforce, Inc. stock shows the neutral signal. See more of Salesforce, Inc. technicals for a more comprehensive analysis.
If you're still not sure, try looking for inspiration in our curated watchlists.
If you're still not sure, try looking for inspiration in our curated watchlists.