RIG forming H&SRig stock is forming H&S if managed to break neckline and close above 2.8 targets are ass on the chart note that usually oilfield companies stocks follows oil price and oil price has been recovering for a while now
good luck :)
TOJ trade ideas

RIG (D) LONG Transocean Ltd. is the world's largest offshore drilling contractor based on revenue and is based in Vernier, Switzerland. The company has offices in 20 countries, including Canada, the United States, Norway, Scotland, India, Brazil, Singapore, Indonesia, and Malaysia.
TECHNICALS:
Price cuts above the neckline (inverse head and shoulders IHNS + 1 shoulder)
Entry Price: $2.82 or closer to neckline (in red)
Take profit:
1) Range - $3.76 - $4.15
2) IHNS TP - $4.69
3) $5.21
Good Luck in Trading
Give us a like if you like our idea.

$RIG Transocean Bullish Analysis
Alerts set for move above Fibonacci Golden pocket @ $2.75.
Potential Inverse H&S forming.
Stochastic bottoming
MACD reversing away from Zero line
Histogram ticking higher
Sector rallying.
Targets $3.14 - $3.50 - $3.82


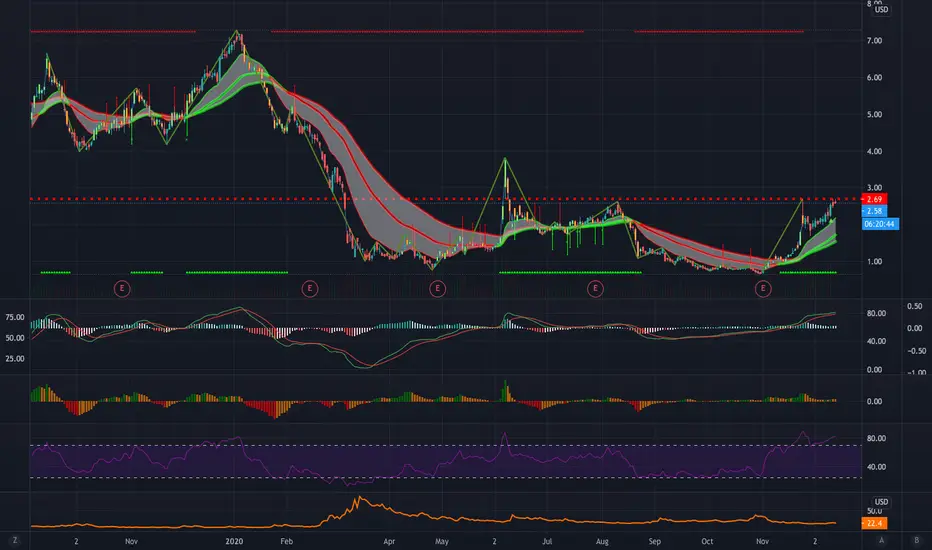
RIG Breakout Stock Sell AlertBREAKOUT STOCK SELL ALERT
$RIG - Transocean Ltd (Switzerland) Common Stock
Initial Alert Price: $2.31
Price High: $2.69
% Gains/Losses: 16.45%
(-48.55% Less Than Expected)
RIG hit the $2.69 Level of Resistance and is currently consolidating from the breakout. It does seem to be rounding back up so we will be watching closelly for another potential breakout here. Until then, we sharing this advisory sell notice.
#Breakout #Stocks #Trading #Investing #Alerts #StockMarket #Daily #News #Today
Follow for more trade alerts and information & egister your account for Instant Alerts by clicking the link in our signature.


RIG Breakout Stock Alert UpdateBREAKOUT STOCK ALERT UPDATE
$RIG - Transocean Ltd (Switzerland) Common Stock
Initial Alert Price: $2.31
Price High: $2.69
% Gains/Losses: 16.45%
(15.8% More Than Expected)
Stop Loss Limit: $2.56
RIG is currently trading in a Continuation Breakout Pattern and working to break the $2.62 Levels of Resistance. If it does, then we expect this retest the $3.82 Level no later than March, if not before due to a catalyst or the Oil Industry finally getting a grip on Production Cuts to account for lower demand in regards of the pandemic. #Breakout #Stocks #Trading #Investing #Alerts #StockMarket #Daily #News #Today
Follow for more trade alerts and information & egister your account for Instant Alerts by clicking the link in our signature.
MM painted LONG pattern cup with handle.RSI low and MA's golden cross.
As well as UKOIL above $50.
And also FDA approved the Pfizer vaccine.

RIG -Transocean LTD - bullish trend Rig is in a clear bull trend right now. Will buy on dip if it happens.

RIG outlookSo looking at RIG on both the monthly and weekly chart, we seem to be due for a correction after a long run upward.
1. We are currently retesting a resistance at which we got rejected recently on the 24th of nov, but also in August and in June, I see this as a high probability area for a breather on the latest upward run.
2. We are approaching the W-cloud, which adds extra resistance.
3. We've recently broken and continued upward from a downward trendline (blue arrow), but without properly retesting it (not always necessary as we did see a brief retest on the daily).
If indeed we get rejected around the area of USD 2.50-2.70, then I will be looking at the following areas for a potential buying opportunity. (There is a possibility that we fill an old gap at 2.85 first as well)
Both the 0.382 fib, the 0.5 fib and the 0.618 fib are potential retrace areas, but I'm looking for confluence of support as well.
The 0.382 doesn't line up with any other areas of interest at the moment.
The 0.5 however lines up with a strong area of horizontal support, making it a more likely candidate. A retrace till here could also potentially see a retest of the previously mentioned trendline (blue arrow). See the orange scenario.
The 0.618 is below what seems as the strongest support. But in a scenario where we need to complete an inverted Head&Shoulders pattern, this area (or beyond) might also still come into play. See the red marks for the iH&S and the green scenario.
So to conclude, it's more likely that we do a retrace soon, then for the uptrend to simply continue. If looking for a selling area, look at USD 2.50-2.70 and perhaps even at the gap at USD 2.85.
If a retrace indeed happens we need to wait for price action to reach the areas mentioned above and wait for buy signals.
If I'm wrong and the trend continues upwards, wait for breaking of resistance and the retest of this resistance.

RIG Brekout Stock AlertBREAKOUT STOCK ALERT
$RIG - Transocean Ltd (Switzerland) Common Stock
Initial Alert Price: $2.31
Potential Price: $3.82
Potential Gains: 65%
Stop Loss Limit: $2.19
RIG is currently trading in a Continuation Breakout Pattern and working to break the $2.62 Levels of Resistance. If it does, then we expect this retest the $3.82 Level no later than March, if not before due to a catalyst or the Oil Industry finally getting a grip on Production Cuts to account for lower demand in regards of the pandemic. #Breakout #Stocks #Trading #Investing #Alerts #StockMarket #Daily #News #Today
Follow for more trade alerts and information & egister your account for Instant Alerts by clicking the link in our signature.

RIG awaiting entry pointSo RIG has been on a huge surge upwards since the end of October, clearly creating some bullish momentum.
Recently the major resistance of USD 1.60-1.80 has been broken upward.
Now I'm looking for a retracement that will provide a good entry point.
Both the 0.318 fib (which for now already has created some support around USD 1.96-2.01) and the 0.5/0.618 fibs are areas to watch.
I'm inclined to say that the 0.5/0.618 fibs are more likely to be retested as they line up exactly with the former major resistance we recently broke (1.60-1.80 as mentioned before).
But we'll have to simply wait and see where a clear sign of support will be formed and then enter the market.

Rig is a buy here11/25
Crossing 50 on the RSI on the 3 day chart. There might be some pullbacks along the road but major up trend has been established it looks like.
Disclaimer, this is only for entertainment and education purposes and doesn't serve by any means as a buy or sell recommendation.
Personally I hold both long term long positions and occasionally short term short position, for disclosure purpose.


Transocean Ltd. Announces Deepwater Corcovado, Deepwater MykonosRIG: Transocean Ltd.
2020-11-18 16:16:03
Transocean Ltd. Announces Deepwater Corcovado, Deepwater Mykonos Contract Extensions


Transocean Ltd. (RIG) may be at a turning point.The latest earnings beat expectations, Transocean could end up as the sole survivor within it's market segment & we might see a mighty short squeeze in a very near future.


K.I.S.S. Can RIG hold THE trend line?Since the beginning of 2010, there have been 5 rejections of a MAJOR RSI trend line on the 3 month big boy time frame, which closes soon.
A successful breakout finally occurred on the 6th attempt.
From the start of the trend line until the point of breakout between Janury and April of 2018, this has held as resistance for just under 8 YEARS STRAIGHT.
3 Monthly candles so far since have closed almost directly on this line, showing buyer support:
The monthly shows an interesting situation. In March, the RSI dipped well below this trend line, but was rejected at entering oversold.
After the oversold rejection, there was another attempt to break back above the trend line. It was rejected:
HOWEVER.
The last monthly was able to close a higher low in the RSI.
The weekly chart is showing that RIG is still above that trend line, but very close:
The daily rose beyond this trend line, but fell back below and has confirmed it as resistance.
This insinuates there is likely still more downside to come yet:
Interestingly, the daily RSI rejection of this trend line also coincides with my mock bear flag on two seperate occasions as shown:
After price fell below my mock bear flag, there was one more test of support and then a nearly 400% rise thereafter.
Not saying this will for sure happen again but it is most definitely worth noting.
To give even more credibility to a possible bounce here:
Histogram and MACD divergence:
3D showing the RSI is now directly on the trend line:
Some positive news:
seekingalpha.com
I'm looking for a liquidity hunt in the mid 80 cent region and buying a small amount of shares there.
If there is serious volume behind the move, this could potentially dump much lower than that.
My shares *will* be a long term hold.
