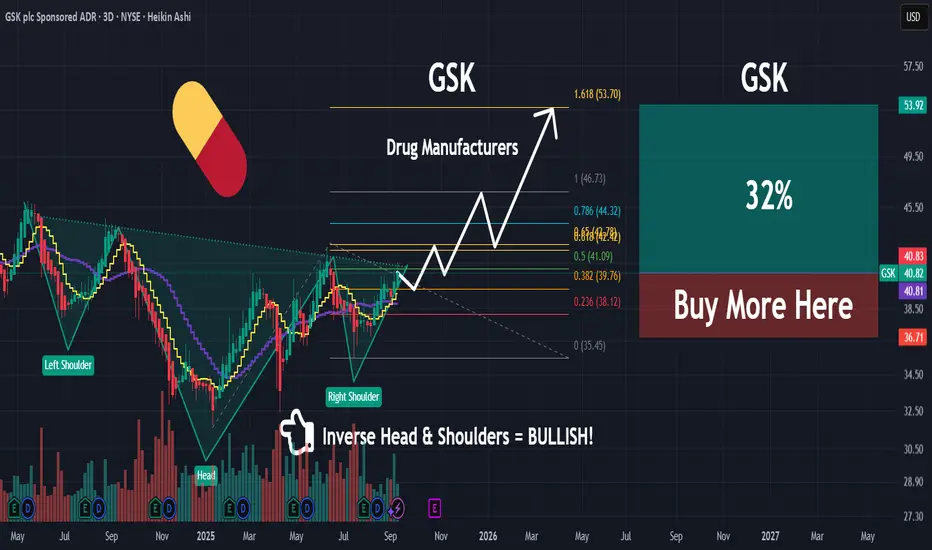
GSK | Powerful Move Going Into 2026 | LONGGSK Plc is a healthcare company, which engages in the research, development, and manufacture of pharmaceutical medicines, vaccines, and consumer healthcare products. It operates through the Commercial Operations, and Research and Development segments. The Commercial Operations segment has three prod
Next report date
—
Report period
—
EPS estimate
—
Revenue estimate
—
1.90 USD
7.70 B USD
44.01 B USD
3.89 B
About GSK plc
Sector
Industry
CEO
Luke Miels
Website
Headquarters
London
IPO date
May 22, 1972
Identifiers
2
ISIN GB00BN7SWP63
GSK Plc is a healthcare company, which engages in the research, development, and manufacture of pharmaceutical medicines, vaccines, and consumer healthcare products. It operates through the Commercial Operations, and Research and Development segments. The Commercial Operations segment has three product groups of specialty medicines, vaccines, and general medicines. The company was founded in 1715 and is headquartered in Middlesex, the United Kingdom.
Related stocks
GSK Breakout Trade – Clean Setup AheadPattern: Bullish breakout from descending wedge
Entry Zone: Around $4.83–$4.97
Stop Loss: Just below $4.70 (trendline + horizontal support)
Target: $5.18 (green resistance level)

$GSKA potential "ABC" pattern has been located here at a level where two previous support levels were broken. Price is near the 11-2023 support level. Looking for a retracement here to two targets overtime.

GSK 1-2 wk swing IdeaNYSE:GSK has set of a daily trigger with a 5/10 ema crossover after a positive earnings report.
During my planning for this idea, I needed to zoom WAY out to the monthly chart in order to understand these levels a bit more. Screen shot of the monthly below:
It turns out that last week's close

GSKNot a recommendation. Held this for a while with very little movement, now GSK as started going up, div yield is over 3.3%

Long GSK - Euro Drug Hype Cycle approachesPlaying short term trade presuming positive news in a week or two.
Shares would return to the range highs near $37.00
Ex-Dividend Date later this week

GSK (GSK) Outperformed Market ReturnsIn the latest trading session, GSK (GSK) closed at $37.10, marking a +1.23% move from the previous day. The stock exceeded the S&P 500, which registered a gain of 0.63% for the day. Elsewhere, the Dow gained 0.59%, while the tech-heavy Nasdaq added 0.39%.
Prior to today's trading, shares of the dru

GSK looking bullish! Buy volume at resistance at this point in the falling channel should help propel the price to an initial measured target if $47 which would be thr breakout point of an even bigger bullish macro setup.

GSK with a bullish outlook following its earnings #StocksThe PEAD projected a bullish outlook for GSK after a negative over reaction following its earnings release placing the stock in drift C with an expected accuracy of 80%.

Long Glaxo Smith Kline (NAS:GSK) looks very good risk returnUsing longer term Auction Market Theory to construct longer term meaningful #VolumeProfiles can sometimes provide exceptional risk reward setups.
One has just popped up in GSK according to my read anyway.
Now price has returned into the longer term Value Area there's a very good chance price will

See all ideas
Summarizing what the indicators are suggesting.
Neutral
SellBuy
Strong sellStrong buy
Strong sellSellNeutralBuyStrong buy
Neutral
SellBuy
Strong sellStrong buy
Strong sellSellNeutralBuyStrong buy
Neutral
SellBuy
Strong sellStrong buy
Strong sellSellNeutralBuyStrong buy
An aggregate view of professional's ratings.
Neutral
SellBuy
Strong sellStrong buy
Strong sellSellNeutralBuyStrong buy
Neutral
SellBuy
Strong sellStrong buy
Strong sellSellNeutralBuyStrong buy
Neutral
SellBuy
Strong sellStrong buy
Strong sellSellNeutralBuyStrong buy
Displays a symbol's price movements over previous years to identify recurring trends.
17RI
GlaxoSmithKline Capital Plc 4.25% 18-DEC-2045Yield to maturity
5.61%
Maturity date
Dec 18, 2045
83GI
GlaxoSmithKline Capital Plc 5.25% 10-APR-2042Yield to maturity
5.56%
Maturity date
Apr 10, 2042
71ZC
GlaxoSmithKline Capital Plc 6.375% 09-MAR-2039Yield to maturity
5.42%
Maturity date
Mar 9, 2039
GSK3981911
GlaxoSmithKline Capital, Inc. 4.2% 18-MAR-2043Yield to maturity
5.16%
Maturity date
Mar 18, 2043
XS217060907
GlaxoSmithKline Capital Plc 1.625% 12-MAY-2035Yield to maturity
5.02%
Maturity date
May 12, 2035
GSK.GJ
GlaxoSmithKline Capital, Inc. 6.375% 15-MAY-2038Yield to maturity
4.87%
Maturity date
May 15, 2038
72WI
GlaxoSmithKline Capital, Inc. 5.375% 15-APR-2034Yield to maturity
4.67%
Maturity date
Apr 15, 2034
GSK6023693
GlaxoSmithKline Capital, Inc. 4.875% 15-APR-2035Yield to maturity
4.62%
Maturity date
Apr 15, 2035
AG99
GlaxoSmithKline Capital Plc 5.25% 19-DEC-2033Yield to maturity
4.57%
Maturity date
Dec 19, 2033
GSK6023695
GlaxoSmithKline Capital, Inc. 4.5% 15-APR-2030Yield to maturity
3.96%
Maturity date
Apr 15, 2030
XS217060184
GlaxoSmithKline Capital Plc 1.25% 12-OCT-2028Yield to maturity
3.95%
Maturity date
Oct 12, 2028
See all GLAXF bonds
ISFD
iShares PLC - iShares Core FTSE 100 UCITS ETF Accum Hedged USDWeight
3.41%
Market value
684.67 M
USD
Explore more ETFs
Frequently Asked Questions
The current price of GLAXF is 28.08 USD — it has decreased by −6.88% in the past 24 hours. Watch GSK plc stock price performance more closely on the chart.
Depending on the exchange, the stock ticker may vary. For instance, on OTC exchange GSK plc stocks are traded under the ticker GLAXF.
GLAXF stock has fallen by −5.58% compared to the previous week, the month change is a 11.41% rise, over the last year GSK plc has showed a 49.89% increase.
We've gathered analysts' opinions on GSK plc future price: according to them, GLAXF price has a max estimate of 37.45 USD and a min estimate of 19.81 USD. Watch GLAXF chart and read a more detailed GSK plc stock forecast: see what analysts think of GSK plc and suggest that you do with its stocks.
GLAXF reached its all-time high on Feb 14, 2007 with the price of 37.37 USD, and its all-time low was 13.48 USD and was reached on Sep 26, 2022. View more price dynamics on GLAXF chart.
See other stocks reaching their highest and lowest prices.
See other stocks reaching their highest and lowest prices.
GLAXF stock is 7.39% volatile and has beta coefficient of 1.04. Track GSK plc stock price on the chart and check out the list of the most volatile stocks — is GSK plc there?
Today GSK plc has the market capitalization of 118.93 B, it has increased by 10.95% over the last week.
Yes, you can track GSK plc financials in yearly and quarterly reports right on TradingView.
GSK plc is going to release the next earnings report on Apr 29, 2026. Keep track of upcoming events with our Earnings Calendar.
GLAXF earnings for the last quarter are 0.34 USD per share, whereas the estimation was 0.32 USD resulting in a 7.15% surprise. The estimated earnings for the next quarter are 0.59 USD per share. See more details about GSK plc earnings.
GSK plc revenue for the last quarter amounts to 11.61 B USD, despite the estimated figure of 11.40 B USD. In the next quarter, revenue is expected to reach 10.43 B USD.
GLAXF net income for the last quarter is 856.82 M USD, while the quarter before that showed 2.71 B USD of net income which accounts for −68.33% change. Track more GSK plc financial stats to get the full picture.
GSK plc dividend yield was 3.62% in 2025, and payout ratio reached 46.78%. The year before the numbers were 4.53% and 96.58% correspondingly. See high-dividend stocks and find more opportunities for your portfolio.
EBITDA measures a company's operating performance, its growth signifies an improvement in the efficiency of a company. GSK plc EBITDA is 14.69 B USD, and current EBITDA margin is 33.51%. See more stats in GSK plc financial statements.
Like other stocks, GLAXF shares are traded on stock exchanges, e.g. Nasdaq, Nyse, Euronext, and the easiest way to buy them is through an online stock broker. To do this, you need to open an account and follow a broker's procedures, then start trading. You can trade GSK plc stock right from TradingView charts — choose your broker and connect to your account.
Investing in stocks requires a comprehensive research: you should carefully study all the available data, e.g. company's financials, related news, and its technical analysis. So GSK plc technincal analysis shows the buy rating today, and its 1 week rating is buy. Since market conditions are prone to changes, it's worth looking a bit further into the future — according to the 1 month rating GSK plc stock shows the strong buy signal. See more of GSK plc technicals for a more comprehensive analysis.
If you're still not sure, try looking for inspiration in our curated watchlists.
If you're still not sure, try looking for inspiration in our curated watchlists.