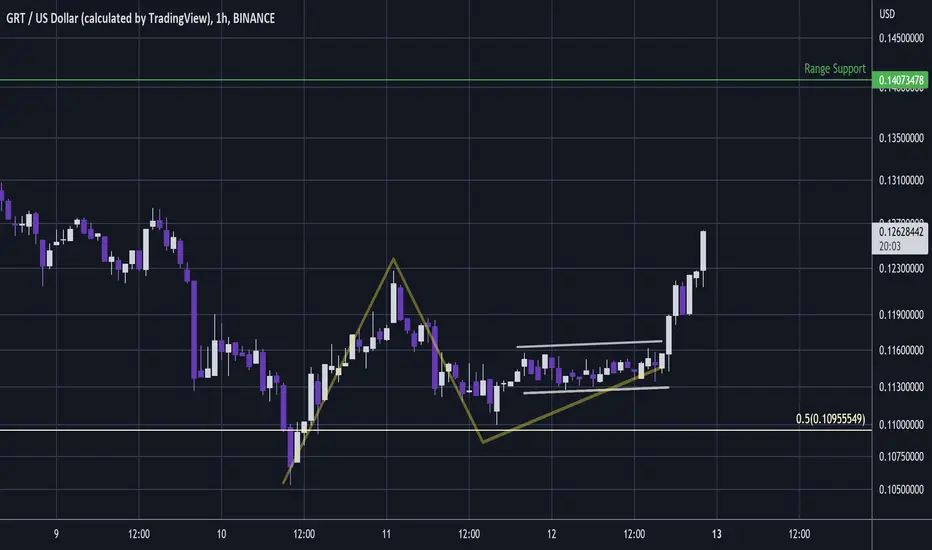
$GRT 1ST LOOKgraph breaking out and heading to .50 IMO
tested the downtrend line
currently using 18 week high/low channel as support
GRTUSD.P trade ideas

GRTUSD Bull Flag completed. Huge rally ahead.GRTUSD just broke above its Bull Flag pattern as well as the MA50 (1d).
With the MA200 (1d) supporting on Fibonacci 0.618, we see this as a solid long-term buy opportunity.
Trading Plan:
1. Buy on the current market price.
Targets:
1. 0.5000 (right under Resistance 1).
Tips:
1. The RSI (1d) has also broken above its own Bull Flag.
Please like, follow and comment!!

#GRTUSD - 25-50% Drop Incoming#THEGRAPH is showing signs of turning relatively bearish sometime very soon. We've had a big pump up and now support is spread thin.
If price was to drop under the nearest level of support we can see losses of at least 25% initially, with potential for twice that.
What Do You Think?
If you enjoyed or agree with this idea - drop us a comment, like & follow! 😀
Ideas by theCrypster meet the guidance notes and disclaimer as mentioned below and within our website. See Signature for more info! ✌️
🔥🔥🔥
Crypto Tipster v2
theCrypster
🔥🔥🔥

GRT - Crypto Is On The Pop!Lots of coins suddenly breaking out here with the BTC bounce and perhaps the next wave up has arrived.
Quite a few coins with similar 3 wave patterns and tight accumulations similar to GRT.
Here GRT has a long tight accumulation at the 0.5 fib retracement.
Stock indexes also opening bullish so its looking positive right here.
Exciting times...
Not advice.
THE GRAPH/GRTUSD UPDATES
If you hold this, we hit TP2. Not financial advice.
Im looking for short.
Congrats and check me out for more free ideas crypto and forex
Thank you.
Follow for more.
.

GRT (the graph) Is confirming breakout from descending channelWe can see here on the weekly chart that GRT (aka The Graph) has broken up from its descending channel and price action is currently very close to the descending channel’s breakout target. Much like many other crypto assets at the moment, we can also see that that descending channel has a large flag pole attached to it as well forming a bear flag. While the descending channel has validated its breakout, it is as of now still uncertain whether or not the bearflag will confirm a bullish breakout as well and pull an inverted Bart pattern. However, CoinMarketCap’s rankings of the “most valuable AI and big data crypto projects and tokens” currently has The Graph as the leading platform in market capitalization. According to Pablo Jodar, a crypto analyst at GenTwo, “I think it is linked to the rally on AI stocks, due to the ChatGPT effect.” Consider all the hype behind AI focused cryptos at the moment this greatly increases the probability that GRT will also confirm the bullish breakout up from the bearflag and reach the higher bearflag target as well. I have posted both targets here on the chart and will update this post once each target is hit. GRT is an indexing protocol that is setting itself up to be the decentralized google for searching blockchains.

GRT/THE GRAPH FUTURES LONG/SHORTLong wait is over, lets try this analysis..
Trade base on your own decissions..
COme and check me out for more.

GRTUSD (1H) - Bullish reversalHi Traders
GRTUSD (1H Timeframe)
Waiting for the upward break of 0.175 resistance level, which will complete a bullish trend reversal pattern to go LONG. Only the downward break of 0.155 would cancel the bullish scenario.
Trade details
Entry: 0.175
Stop loss: 0.155
Take profit 1: 0.188
Take profit 2: 0.208
Score: 7
Strategy: Bullish reversal

THE GRAPH FUTURESI see forming short demand mitigations for bearish liquidity here.
Trade base on your own decissions.
COme and check me out for more Futures Ideas.
Currently focus on AI coins.. keep updated for more

100% return shorting GRT!!!!!!!!!We are now showing signs of a short term bullish reversal which in turn will take us to our target for the remainder of the short at .20, @MP MoonBoys you can either watch or add to your positions here as the target is our original entry.
WHY WE SHORT..... early analysis shown to me what looked like a MMSM but after we seen a blow through the orderblock i marked price then ran the monthly swing high, which now is a higher timeframe break in market structure.
1st Target for the short .12
If we get a candle close below .13 withing the next 2 days then we have a weekly bearish SFP and well then look to target the lows.
Ill keep you UPDATED as price play out but this could potential be a 100% return...
AND TO EVERYONE WHO JUMPED IN THE COMMENTS ON THE LAST GRT POST, GO BACK AND READ IT AGAIN AND NOTE DOWN WHAT I SAID WELL BE DOING.
ALSO THANKYOU FOR BUYING .20 BECAUSE I KNOW YOU DID.

GRT bounce level on this phaseA big bounces in this period of the market
GRT looking had enough of all that sell power.

$GRT #GRT market maker sell modelCurrent bullish trends has all levels of a market maker sell model, now we wait to see lower timeframe manipulation and shift in structure to the downside.
NEW LOWS TO BE SET

the GRT is linear?graphs arnt always linear however this one seems like its headed straight to the moon! depending on how the space treats this moving forward, should see a retest of this level at the very least and if youre nimble theres a potentiall for a few hundred percent for those hungry enough!

graPHIcThis is coming to a huge confluence
Downtrend line
Local resistance
Median line
Something has to give
It could reject the median and consolidate
But longterm- ONLY UP
GRI 2023

GRTIndexing protocol for blockchains
Looks to be breaking out
Some targets marked
I’d be happy to move on at the first but you could hodl this for a whole cycle
NOT TARDING ADVICE
GRI 2023
Ps am only posting stuff for me so #getrektnoobs

for pinescriptfor pinescriptfor pinescriptfor pinescriptfor pinescriptfor pinescriptfor pinescriptfor pinescriptfor pinescriptfor pinescriptfor pinescriptfor pinescriptfor pinescriptfor pinescriptfor pinescriptfor pinescriptfor pinescriptfor pinescriptfor pinescriptfor pinescriptfor pinescriptfor pinescriptfor pinescriptfor pinescriptfor pinescriptfor pinescript


GRTUSD (Daily) - Bullish reversalHi Traders
GRTUSD (Daily Timeframe)
Waiting for the upward break of 0.0755 resistance level, which will complete a bullish trend reversal pattern to go LONG. Only the downward break of 0.0535 would cancel the bullish scenario.
Trade details
Entry: 0.0755
Stop loss: 0.0535
Take profit 1: 0.0892
Take profit 2: 0.1110
Score: 5
Strategy: Bullish reversal

GRT $.14-$.15 incoming soon!GRT will see big returns soon. A matter of time. I am not saying this target will hit in a specific time frame but it is ready to move up to at least the $.14-$.15 level soon. RSI and Macd are confirming this move. Now volume and she blows!

GRTUSD broke above major Resistance. Potential uptrend ahead.The Graph (GRTUSD) broke today above the Lower Highs trend-line that has been in effect since the August 08 2022 High. Supported by the 1D MA50 (blue trend-line), GRT is now aiming at the 0.07725 - 0.0750 Resistance Zone (made on the November 23 - December 10 Highs).
With the 1D RSI on Higher Lows since October 20, it is highly likely that this will be a sustainable bullish break-out. However the RSI has has clear highs to sell, near the 80.000 overbought barrier, where price tops where formed.
As a result, we are looking for levels to peak and the pull-back and as shown on this chart, the Fibonacci retracement levels align perfectly with previous Support and Resistance levels since the August downtrend started.
As a result the next level to watch is the 1D MA200 (orange trend-line) on the 0.382 Fib, with a major Resistance cluster being on the 0.5 Fib.
-------------------------------------------------------------------------------
** Please LIKE 👍, FOLLOW ✅, SHARE 🙌 and COMMENT ✍ if you enjoy this idea! Also share your ideas and charts in the comments section below! This is best way to keep it relevant, support me, keep the content here free and allow the idea to reach as many people as possible. **
-------------------------------------------------------------------------------
You may also TELL ME 🙋♀️🙋♂️ in the comments section which symbol you want me to analyze next and on which time-frame. The one with the most posts will be published tomorrow! 👏🎁
-------------------------------------------------------------------------------
💸💸💸💸💸💸
👇 👇 👇 👇 👇 👇

GRT tenative top price and dateIf you followed my GRT chart, then you know we bottomed. .0516 on the money. We'll go to about 1 cent, then ultimately to almost 2 cents. on~ April 13th
Just my two cents though.
IF you missed the buy, dont worry, there will be another great opportunity to pick it up at a low price before it ascends.

GRT the way of 3, 8 and 1Hi, i can see that floor is close to us. Of course, mabe its death project, than floor is zero. But another levels are:
0,0381
0,0138
peace and love
