The Setup Is Bullish❕ WAVE 4 Completed By The Beautiful ABC Correction ,At The Moment The Price Sitting Above The Strong PRZ Zone ,Expect The Breakout From Trend Line Soon
🔴 Stop loss zone : 480 ~ 470
HBARBTC trade ideas


HBAR / BTC - 1000+ Sats in Sight NextQuick bullish idea for HBAR / BTC. I actually found this old chart in my list and hadn't checked it in weeks, everything was already drawn as-is except for the orange target line, and it was missing the fibs. If we continue to follow this channel and have a repeat of the previous move, we should see over 1000 sats relatively quickly when it starts to move again.
Note that volume has been rather low after the big move, yet it has still made significant gains and losses after hitting the previous high 29 days ago and then moving somewhat "sideways" since. If significant volume returns with an upward move, we could easily see another fast and strong move like the last one.


HBAR BTC WAVES FORM#HBARBTC BINANCE -SPOT
11-APRIL-2021
1D
👉Entry: 500 - 600
🚀Targets: 751 - 997 - 1542
⚡️use 5% max of your deposit
🚦STOP: 459
🚦STOP: Close daily candle below 400


HBAR HBAR vs USD in a narrow lateral range, the exit side will indicate the direction that the new trend could take, signal that it could be ahead of HBAR / BTC where the range is much wider and less defined
Overall it seems interesting to me and it may be worth following this crypto


HBAR a project for which the world's giants stand. 🚀We have been studying this HBAR for a long time, the foundations of this coin are impressive. The world's giants are behind it - google , boieng, lg and many many more. So if this project is from top100 and it has one of the best foundations and strong support from the richest companies, what could go wrong? :)
Our subscribers are happy that they know about HBAR from many weeks and now they are on +100% profit (in btc ). 🚀
We also have huge bag of this coin and we are still strongly bullish .
🚀 This coin is on our golden long-term altcoins list. It may be very good project for long term investment.
❎ No TP for long-term investments. We can`t predict exact altcoins targets in long term, but thanks to our experience and glassnode we are able to predict exact bitcoin targets. Our long-term strategy is just to hold these altcoins until glassnode indicators will say us that we are close to end of bullrun. And then we will sell everything in 15% parts.
✅ Bullrun is easy. Just accumulate coins from our golden list (long) and play with our signals (short). Diversification is the key to success.

HBAR/BTC TA update and 100% potential from here#HBAR/BTC TA Update:-
#HBAR currently trading at 566 Satoshi
And strong support at 540 Satoshi
Entry:- 540-565 Satoshi
Targets:- 721/1153 Satoshi
Stop Loss:- If 4H candle below 520 Sat
Support:- 540 Satoshi
Resistance:- 721 Satoshi
Please click LIKE button and Appreciate my hard work.
Must follow me for latest crypto real time updates.
Thank you.

Crypto|HBAR/BTC|Long and shortLong and short HBAR/BTC
Activation of the transaction only when the blue zone is fixed/broken.
The author recommends the use of anchoring fixed the blue zone, this variation is less risky.
If there is increased volatility in the market and the price is held for more than 2-3 minutes behind the activation zone after the breakdown, then the activation of the idea occurs at the prices behind the activation zone.
Working out the support and resistance levels of the consolidation zone.
* Possible closing of a trade before reaching the take/stop zone. The author can close the deal for subjective reasons, this does not completely cancel the idea and is not a call to the same action, you can continue working out the idea according to your data, but without the support of the author.
+ ! - zone highlighted by the ellipse is a zone of increased resistance, in this area there is a possible reversal for a correction, please take this factor into account in this transaction.
The "forecast" tool is used for more noticeable display of % (for the place of the usual % scale) of the price change, I do not put the date and time of the transaction, only %.
The breakdown of the upper blue zone - long.
Breakdown of the lower blue zone - short.
Working out the stop when the price returns to the level after activation + fixing in the red zone.
Blue zones - activation zones.
Green zone - take zone.
Red zone - stop zone.
Orange arrows indicate the direction of the take.
Red arrows indicate the direction of the stop.
Priority - The value of the priority parameter implies the author's subjective opinion about the more likely activation zone on this idea, this does not mean that this idea will be 80% activated by this parameter, the purpose of the parameter is to provide for the risk of the inverse of the zone parameter.
Example: "Priority Long: So the author inclines more in the direction of the activation zone open long trades, in this case, when reaching the activation zone in short you should be very careful, because this area may be highly likely to be punched about the breakdown/do not get to take/activate transaction from go to stop."
Please consider this parameter if you use my ideas.
SUM PNL: This parameter displays the total % of all closed ideas of the "new" format (according to the author) for this sector at the time of publication of the idea. The calculation is very "clumsy" just the sum of the profits of all the ideas, based on this indicator, you can more accurately assess the risks when working with my ideas of this sector. I present you the construction of the idea, you can use it yourself as you like based on your subjective view and risks, the calculation of the PNL indicator is carried out only on transactions that the author closed on TV in manual mode or by take.
P.S Please use RM (risk management) and MM (money management) if you decide to use my ideas, there will always be unprofitable ideas, this will definitely happen, the goal of the system is that there will be more profitable ideas at a distance.


HBAR / BTC - Bullish Continuation ScenarioHere's a quick & dirty bullish continuation scenario idea for HBAR / BTC breaking out of a triangle drawn based on current price action on the 30min chart.
Rough targets on the chart.

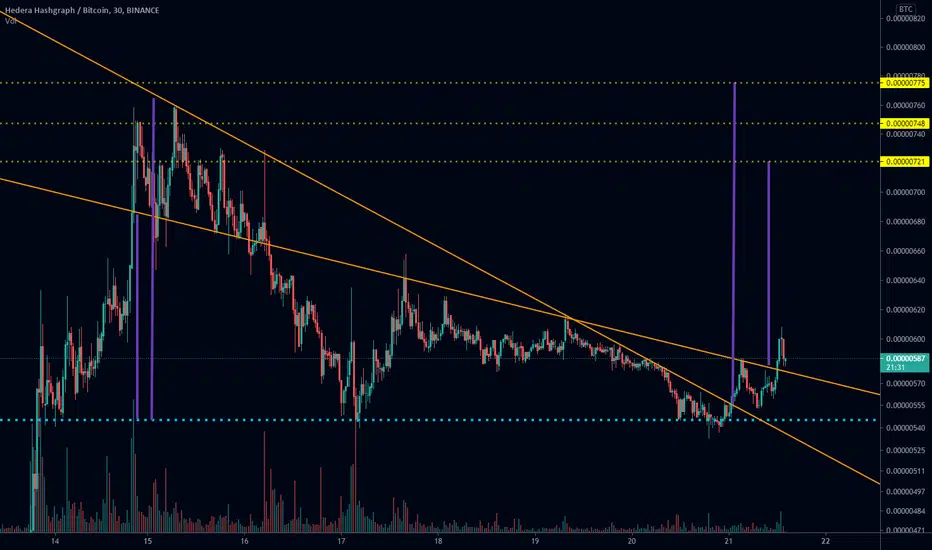
HBAR / BTC - Breakout / Re-testing - Short-term gainsQuick chart for HBAR / BTC 30min time-frame:
-- Good chance to visit 721, may see slightly higher high ~775.
Two possibilities after that:
1.) touch previous all-time high around 817-867, or
2.) a double top here and a significant pullback into the low 400s.
At the moment, double top seems possible because prior to breaking out we were forming a wedge testing 530s, although larger timeframes indicate a new ATH is coming before we see any good pullback, and then continued new highs beyond that. See LINK comparison below.
Also, USD pairing formed a W on the 30min chart, broke-out, and is currently re-testing the top:


$HBAR, Crossing over ~570 sats and hodling/trying to flip it$HBAR
Crossing over ~570 sats and hodling/trying to flip it into support on the way up
Looking good as volume is showing strong volumes on daily basis.
If manages to bounce, then looking for ~700/850 sats (ATH)
UCTS Bullish across the board (70%+ since 3D Buy signal)
#HBAR

HBAR.BTC (Y21.P2.E1).Cradle setup Hi Traders,
A cradle setup on the 4 Hrly with MACD convergence.
I believe BTC will find this current level as strong support so no surprises to break this setup.
How to trade this?
On the 1 hour, use the 13/50 ema x over as a confirmation tick in the box and
possibility the MACD cross over as well.
The closure of the 4 hrly bullish candle should be sufficient but I like looking at the lower time frames to get a feel for what's going on.
Ideally I would have liked the pullback a bit more deeper to one of these fib levels, so this part is the only thing that doesn't sit well with me.
Note, the blue ema's are the 10 and 20 on the 4 hrly.
All the best,
S.SAri

Rhymes and Rhythms. What's your strength? HBAR:BTC As a Trader it's important to know your strengths... & your weaknesses. When you're self-aware you have no more excuses. It's not the markets fault, it's yours. Own it. And work on getting better tomorrow than you were today.
My trading personality is:
A "Patient Gem Fossicking, Value Investing, Swing Trader, with a specialization in capitulation."
Identifying the following strengths and weaknesses is how I came to understand what my trading personality is. What's yours?
My strengths:
I trade better looking at 'the bigger picture' (1 day bars plus)
My best trades come during capitulation (for entry's and exits on long term swing trades)
Ability to get big in my best setups (having confidence in my analysis allows me to comfortably get in with size)
I have excellent visual 'pattern recognition' (allows me to identify patterns that others often miss)
I am extreemly patient (can sit in front of the screen, analyze the carts and not take a single trade for months)
My weaknesses:
Short time frame scalping (Too much information to process & patterns are less reliable)
Holding trades that go against me because "I really like the project" (next minute f**k it... guess I'm an investor now)
Incorrect position sizing (Incorrect risk in some shitcoin trades)
Not entering and exiting trades correctly (Often 'all in' & 'all out' in one go)
Trading setups that aren't my best
The reason for sharing some of my strengths and weaknesses is to get you thinking about what yours are. A good way to identify them is to create a 'playbook' of your setups. Record your trades in a journal as they happen. Review your winners and losers daily. Analyze yourself. What did you do well and what could you improve on? Once you know what your best & worst setups are, you can work on reducing your least profitable trades and start taking more of your most profitable trades. Journaling will also help you identify any good and bad habits you may have. When you have a good idea of where your best trades are, the next step is to learn how to get bigger in these 'best setups'. If you're interested in learning more about this process I highly recommend reading "The Playbook" by Mike Bellafiore. If you're struggling as a trader, the answers to most of your problems are in that book. Good luck!
Oh and as for this HBAR:BTC chart.. They say history never repeats, But it defiantly seems to rhyme. One of my strengths is 'pattern recognition' and it looks to me like a moonshot is incoming for HBAR... Just saying.
Can this pattern fail? Absolutely. Am I in this trade? Definitely.
Never Trust. Verify.
D.Y.O.R. Not Financial Advice Just an Observation.
Technical Analysis is not about being right, it's about increasing your odds.
Be prepared to be wrong. Risk management is key . Capital preservation above all else.

$HBAR* I love bull flags. They always show me the way.
* Sitting on support
* MACD Bullish
* Standard Bank Group establishes Africa’s first Hedera network node to enable much-needed digitisation of cross-border trade processes
* Best time to buy break out retest of 276 sats.
