#HBARUSDTCRYPTOCAP:HBAR
Getting are entry for the bullish continuation, expecting more pump
#forex #forextrading #forexsignals #crypto #forexlifestyle #money #lifestyle #trade #stock #cash #iphone #daytrading #currencytrading #tradingonline #swingtrading #profit #forextips
HBARUSDT.P trade ideas

Hedera (HBAR)On the above weekly chart price action has corrected over 90% since the sell signal (not shown). Today is great long opportunity. Why?
1) RSI and price action resistance breakout with support confirmation.
2) Multiple oscillators print bullish divergence.
3) Trend reversal. Higher highs higher lows replace lower highs lower lows.
4) The macro bull-flag confirmation prints the 50 cent target.
Is it possible price action falls further? Sure.
Is it probable? No.
Ww
Type: trade
Risk: <=6% of portfolio
Timeframe: Now, don’t sit on your hands.
Return: 8x

Bullish continuation: this looks bullish AFDescription:
- 1-2, 1-2 setup, 2nd wave (leading diagonal).
After some research concluded that there are only 2 bullish scenario's, namely 1) straight into 3rd wave or 2) in B wave (ABC). For obvious reasons, a prolonged correction would be ideal. A deeper pullback for a wave C would bring the 1.618fib much higher.

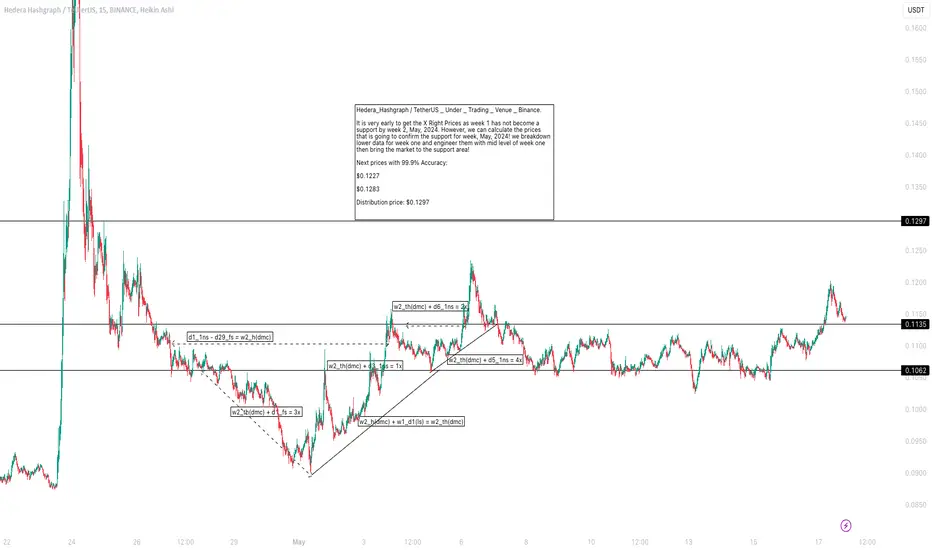
Hedera_Hashgraph / TetherUS _ Under _ Trading _ Venue _ Binance.Hedera_Hashgraph / TetherUS _ Under _ Trading _ Venue _ Binance.
It is very early to get the X Right Prices as week 1 has not become a support by week 2, May, 2024. However, we can calculate the prices that is going to confirm the support for week, May, 2024! we breakdown lower data for week one and engineer them with mid level of week one then bring the market to the support area!
Next prices with 99.9% Accuracy:
$0.1227
$0.1283
Distribution price: $0.1297
#HBAR/USDT LONG ENTRY#HBAR/USDT LONG ENTRY
Leverage: 3x
Entries: $0.11564
Take profit 1: $0.11931
Take profit 2: $0.12321
Take profit 3: $0.13747
Stop Loss: $0.10664
NOTE: This is just my prediction. Be sure to use STOPLOSS and remember that I am not a financial adviser. your money, your risk!
BINANCE:HBARUSDT.P
Thanks
The sroced.

HBAR idea | HbarUSDT key levels HBAR | HbarUSDT key levels
best time for hbar will be only above $0.1254/0.1707
closing/opening must be above $0.1254

👀short-mid term targets for $Hbar! 45%-100%+ possible Hello traders! I have been watching the overall crypto market for a while. Btc recently crashed down to $40k from 49k but it was very necessary move to cool down the market,adjust the RSI values and kick some weak hands out of trade! Btc feels stable above $40k .Of course there may be some successful attempts to go down below this level or not.Most importantly I am not focusing on Btc giant's short term tricks. It is all part of illusion or some would call it warm up run before the fireworks. Soon Btc will break above 50k and altcoins will flourish at that point!
Recently Hbar making significant progress all around.Very healthy correction on short and long term charts and weekly rsi is at strong 59 and chart looking like a golden statue👀 .It would be quite mistake to ignore this giant! If you are not familiar with the project please do some research! My personal assumption is that we going to see major move with this coin. It could be a lot more than what my prediction is but I need to keep it realistic!
Good Luck!

HBARUSDT 2H#HBAR is moving inside a symmetrical triangle on the 2H timeframe. Wait for the breakout or breakdown and then enter. If it breaks the triangle to the upside:
$0.1149
$0.1226
If it breaks the triangle to the downside:
$0.1025
$0.0970

HBAR is in nice entry zone!Hedera (HBAR) is one of the coins which I like because of their technology and a lot of other things that you can find on their network. Also they have a lot big companies like Ubisoft, Google and IBM as a part of the Hedera Governing Council. Price is now in good entry zone for those who would like to buy it. This is trade (investment) setup on larger timeframe. I am not looking to reach targets 2,3,4 and 5 very soon, that could be year(s). I will sell most of my capital on targets 3,4 and 5. Small portion will be sold on Targets 1 and 2.
Entry Zone: 0.040 – 0.049
Buy Zone: 0.0125-0,0203
Target 1: 0.24 – 0.26 (394%)
Target 2: 0.31 – 0.33 (546%)
Target 3: 0.42 – 0.44 (774%)
Target 4: 0.56 – 0.58 (1043%)
Target 5: 0.90 – 0.95 (1761%)

Trading Signal For HBARUSDT Trading Setup:
A Trading Signal is seen in the HBARUSDT HederaHashgraph (15m) (Futures)
Traders can open their Sell Trades NOW
⬇️ Sell now or sell on 0.1205
⭕️SL @ SL: 0.1262
🔵TP1 @ 0.1093
🔵TP2 @ 0.1000
🔵TP3 @ 0.0848
What are these signals based on?
Classical Technical Analysis
Price Action Candlesticks Fibonacci
RSI, Moving Average , Ichimoku , Bollinger Bands
Risk Warning
Trading Forex, CFDs, Crypto, Futures, and Stocks involve a risk of loss. Please consider carefully if such trading is appropriate for you. Past performance is not indicative of future results.
If you liked our ideas, please support us with your likes 👍 and comments .

HBAR 30c incomingAfter the blackrock breakout and the ETH maxi FUD bringing us back to earth, she looks fully reset and ready to run.
Only a matter of time till the trade is complete to 28/30c, and as these are high retracements on the market cap chart, I am dipping.
One of the best assets in the space, the tech is unrivalled. Maybe not the biggest gains, but definitely one of the safest. Send it

HBAR Trading ScenarioWe're looking at how the price of HBAR has been moving recently.
After dropping to a low of $0.0666, it bounced back up to $0.1818. The growth was more than 170%. Then, the price dropped back down to $0.0903. Right now, the asset price is trying to strengthen.
As for now, the market is showing that sellers are in control, so we can probably expect the HBAR price to keep dropping. If you're looking to get in on this, you might want to consider buying when the price touches the 200-day moving average or when the volume level POC declines.

HBAR/USDT The main trend (the whole trading history). Pivot zoneLogarithm. The time frame is 1 week. An idea for understanding the underlying trend and cycles.
The coin is the 30th most capitalized coin according to coinmarketcap as of September 9 (9 11), 2023.
The large time interval and long history of the chart shows not only the cyclicality of the past, but also the more likely future. This idea makes it clear how important for the market (not only for this cryptocurrency) this time zone is, which will determine the further development of the long-term trend.
Many for some reason consider a separate altcoin separately from the whole market and are sure that its trend should be different from the general direction of the market (stock, bitcoin), this is an extremely wrong approach.
It is worth noting that quite a few large wallets of this cryptocurrency have been created over the past few months. Whether people accumulating this asset will be right or wrong, only time will tell. Everything will be decided in the coming months.
Line chart.

HBAR: I'm going all in on this dip.A solid demand zone for HBAR, and I'm keeping an eye out for a dip, especially with Bitcoin's current trend. If Bitcoin drops, HBAR follows. This could be a prime opportunity for a long.


HBARUSDT is going for a higher low againhi traders
After a recent mega pump caused by some new, HBAR retraced almost all the move.
In my opinion, HBAR is going for a higher low which will be a great place to buy some HBAR again.
Targets for longs are 0,14 and 0,1585
This is another example of the chart that proves why it's important to take profit in the cryptocurrency market (and any other market) when assets mega pump in a short period on some 'positive' news.

HBARUSDT UPDATEDear Respected Traders, we hope this communication finds you well.
we are convening a discussion focused on #HBARUSDT.
HBARUSDT Broke the trendline and now retesting it 1D time frame.
Soon we will see a bullish move of 80% .

HBAR testing previously resistance turned support - LONGIn a bull market, we can have x150 but ONLY IF you can survive 30%, 50%, even 75% drops
If not convinced, just check out the huge pull backs during DOGE's last bull market.
Now, it means that IF you survive, you WILL make money.
Don't use too much leverage & Don't FOMO. Simple & Easy
HBAR / weekly
It is HEALTHY that we are re-testing the green zone which was red (resistance) for 2 years.
And it is still more than +200% up since the lows in late 2022.
Relax & BTFD

Bouncing Up from a strong daily support Reaching Strong Daily support and being a strong project, I am bullish.

Pullback nearly done | Long BiasOn day chart
HBAR is pulling back to Fair Value Gap
Wait for rejection
Join to long
Time will tell

HBAR/USDT CUP & HANDLE TARGETAfter a 2-year accumulation phase, Hbar broke out of its major resistance level, and I believe this is the start of wave 1 of 5. The chart shows linear and logarithmic one-to-one price extensions of cup & handle patterns.
There was a massive volume spike across multiple exchanges including Binance. I have set the target area where the price level converges with fib retracement targets. However, I believe Hbar will ultimately break out of this entire structure and continue to rise in price.
I expect a minimum market cap of GETTEX:70B to $100B for Hbar, as it is an outstanding project with advanced technology and significant public adoption.
Please note that this is not financial advice, only my personal opinion. Good luck with your investments.

RED is for buying! gotta bet on this one! Afternoon fellas,
Figured I'd come back with another one during these red days...
Pumped the other day and I did sell some. But looking into this setup following up the previous pump.
This post is also a follow-up from the previous post. Check it out!
Trade thirsty.

HBARUSDT(Hedera) Daily tf Range Updated till 25-04-24HBARUSDT(Hedera) Daily timeframe range. even on slow days like these it had a nice pump. but the pump didnt sustain as its retraced. closing below 0.1217 clean will led it to 0.0937. if not it can get over 0.1217 again.
