HBAR LONGIt moves close to the bottom of its channel. It is very good for its price. We expect it to return to its upward trend in the next two months BITHUMB:HBARKRW BINANCE:HBARUSDT BITSTAMP:HBARUSD

HBAR could have completed long-term ABC correctionBased on the Elliott Wave theory, it seems that HBARUSDT has been undergoing an ABC corrective pattern throughout the past two months. The correction has ended right at the previous supply area, which has transformed into a demand zone.
Therefore, it is reasonable to assume that buyers are startin

|| HBARUSD || BREAKOUT PATTERN INCOMING!Current market sentiment has been fairly bullish resulting in a great week for the top 10 crypto assets, however, we are still to see a snowball effect onto assets outside of the T10.
Today I shall be discussing my perspective on the current Hbar market structure and why I feel it will be caught b

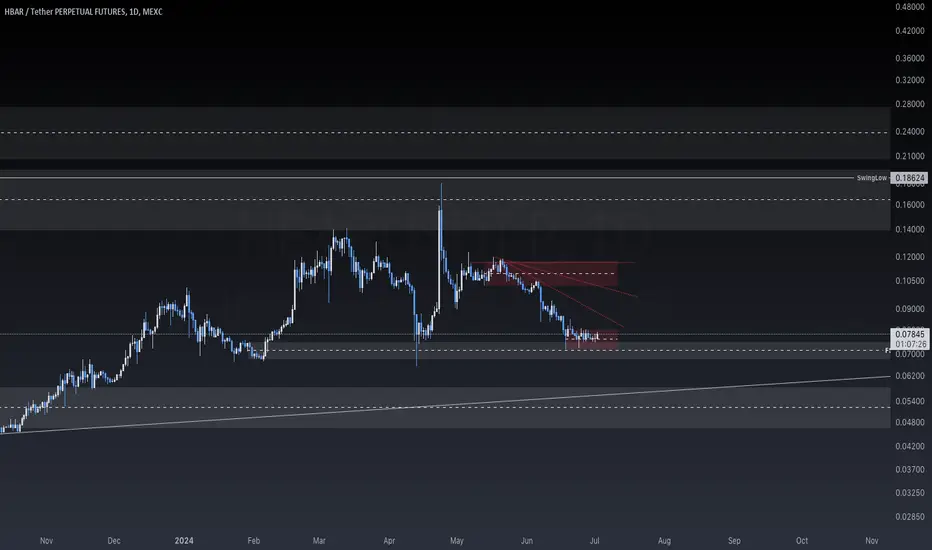
30% UP or 30% DOWN Incoming!Currently trading at demand. If we get some buying pressure and start breaking previous candle highs, a 30% move to the upside is likely.
If we flip demand into supply, an almost equal move to the downside to the next support will become the most probable outcome.
Calculate Your Risk/Reward so yo

HBAR to 0.14 (+55%)HBAR can move to 0.115 and then to 0.14, which would result in potential profits of 27% and 55% respectively. The stop loss is set at 0.06 (-33%). P.S. For traders operating on longer timeframes, there could be another target at 0.2, which would yield a profit of +122%.
Please note that this is a p

HBARUSD BUY (RRR 1:3,85)Hello,
Here's a concise update based on our latest technical analysis chart:
Liquidity Sweep
We've seen a liquidity sweep, where the price dipped to clear out stop-loss orders, gathering liquidity for a potential upward move.
Broken Downtrend
The downtrend has been broken, suggesting a possib

HBAR/USDTIts good for spot on Mid/Long term!
HBAR is relate to a wonderful project!
2 step is logical for buying according to DCA !
stoploss will be activated if daily close seen under the last step

HBAR - weekly levels and a few daily dabblingsSaw someone post on X about HBAR and remembered I should check on it and see the long term outlook of things.
Daily timeframe with a weekly / monthly outlook so come back to this one at the end of the year lol.
HBAR: I'm going all in on this dip.A solid demand zone for HBAR, and I'm keeping an eye out for a dip, especially with Bitcoin's current trend. If Bitcoin drops, HBAR follows. This could be a prime opportunity for a long.

The time is drawing near for HBAR.After the amazing rally that we saw a few months ago, the price of HBAR has been decreasing steadily with the broader crypto market, allowing retail investors to stockpile the asset.
Enjoy the ride!

See all ideas
Frequently Asked Questions
The current price of Hedera Hashgraph / TetherUS (HBAR) is 0.0683 USDT — it has fallen 0.15% in the past 24 hours. Try placing this info into the context by checking out what coins are also gaining and losing at the moment and seeing HBAR price chart.
Hedera Hashgraph / TetherUS price has fallen by 8.57% over the last week, its month performance shows a 10.37% decrease, and as for the last year, Hedera Hashgraph / TetherUS has increased by 31.85%. See more dynamics on HBAR price chart.
Keep track of coins' changes with our Crypto heatmap.
Keep track of coins' changes with our Crypto heatmap.
Hedera Hashgraph / TetherUS (HBAR) reached its highest price on Sep 16, 2021 — it amounted to 0.5760 USDT. Find more insights on the HBAR price chart.
See the list of crypto gainers and choose what best fits your strategy.
See the list of crypto gainers and choose what best fits your strategy.
Hedera Hashgraph / TetherUS (HBAR) reached the lowest price of 0.0091 USDT on Dec 31, 2019. View more Hedera Hashgraph / TetherUS dynamics on the price chart.
See the list of crypto losers to find unexpected opportunities.
See the list of crypto losers to find unexpected opportunities.
The safest choice when buying HBAR is to go to a well-known crypto exchange. Some of the popular names are Binance, Coinbase, Kraken. But you'll have to find a reliable broker and create an account first. You can trade HBAR right from TradingView charts — just choose a broker and connect to your account.
Crypto markets are famous for their volatility, so one should study all the available stats before adding crypto assets to their portfolio. Very often it's technical analysis that comes in handy. We prepared technical ratings for Hedera Hashgraph / TetherUS (HBAR): today its technical analysis shows the sell signal, and according to the 1 week rating HBAR shows the sell signal. And you'd better dig deeper and study 1 month rating too — it's sell. Find inspiration in Hedera Hashgraph / TetherUS trading ideas and keep track of what's moving crypto markets with our crypto news feed.
Hedera Hashgraph / TetherUS (HBAR) is just as reliable as any other crypto asset — this corner of the world market is highly volatile. Today, for instance, Hedera Hashgraph / TetherUS is estimated as 0.88% volatile. The only thing it means is that you must prepare and examine all available information before making a decision. And if you're not sure about Hedera Hashgraph / TetherUS, you can find more inspiration in our curated watchlists.
You can discuss Hedera Hashgraph / TetherUS (HBAR) with other users in our public chats, Minds or in the comments to Ideas.