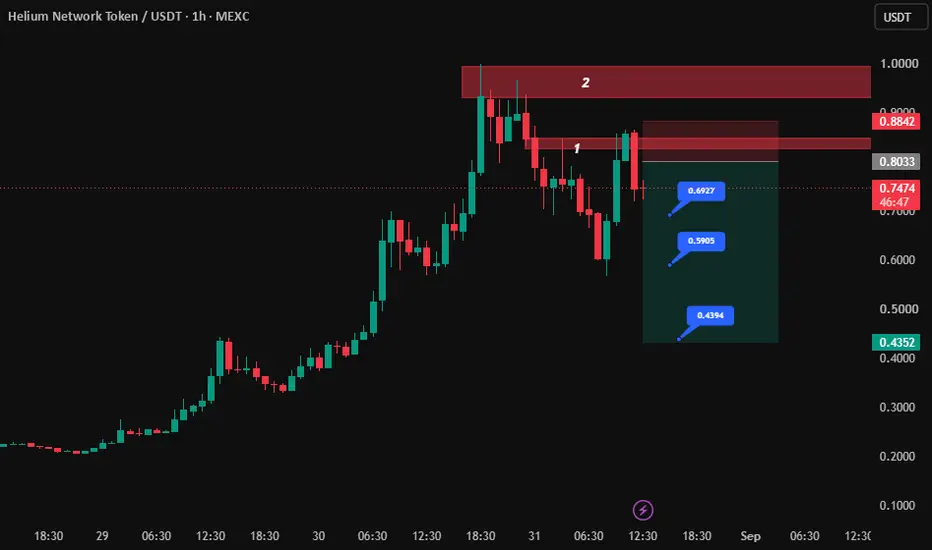
#HNTUSDT 1H / qm#HNTUSDT 1H
#HNT has formed reversal patterns and created a short opportunity.
If the decline continues, it could reach the targets.
If Zone 1 is lost, we'll wait for Zone 2 and then look for short confirmation.
I've marked everything clearly for you.
Use maximum 5x leverage.
⚠️ Risky trade.
HNT Surge Triggers Short SqueezeFWB:HNT Celina, Texas—the fastest-growing U.S. city—announced it is powering citywide mobile coverage using the Helium Network, repurposing existing public Wi-Fi at libraries and businesses. This "carrier offload" deployment handles about 100 GB of data daily without new cell towers, showcasing a c
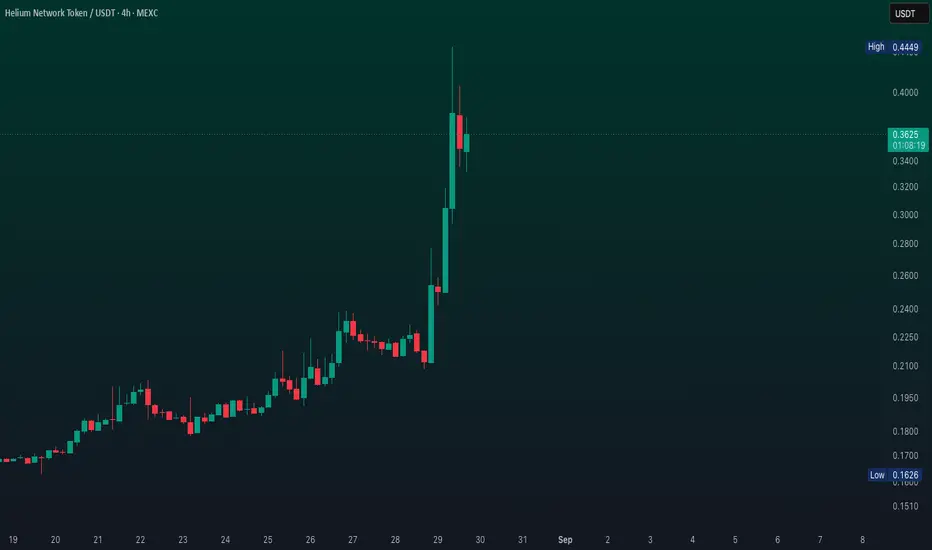
$HNT JUST PUMPED 318% | IS THE NEXT 50% RETRACEMENT COMING?FWB:HNT JUST PUMPED 318% | IS THE NEXT 50% RETRACEMENT COMING? DON’T CHASE THE PUMP
FWB:HNT has exploded from $0.167 → $0.699, marking a massive +318% move in just two weeks.
After such a vertical expansion, I would NOT take a fresh aggressive entry here. The risk/reward is heavily skewed after
HNTUSDT Bearish Structure Still DominantHNT continues to respect the broader macro downtrend, with price consistently rejecting key resistance levels. The main supply zone around $10.4 previously acted as a major distribution area, confirming strong seller dominance. Price is now trending within a descending structure, and the next area o
HNT 9x Breakout With Normal Volume Structure HNT 9x Breakout With Normal Volume Structure and Floor Leverage — Clean Setup
Overview
HNT is printing 1.557 with futures at 1.554, showing an extreme bull reading at 71.19% intensity. Bulls hold 85.6% against just 14.4% bears with 49% clarity. This is the most decisive signal distribution you wi
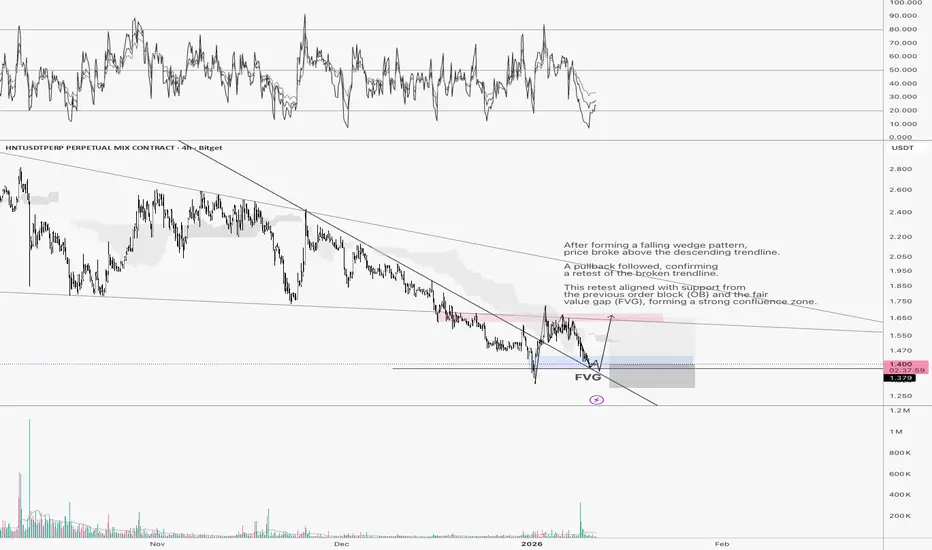
HNT Bull Trap… or the Start of a Massive Move?Yello Paradisers, did you notice what just happened with HNT? While most crypto traders were panicking due to the lower lows, we spotted a hidden bullish divergence forming, and it appears the market is now waking up to it.
💎 After weeks of trending inside a clean descending channel, #HNTUSDT just
HNTUSDT 2D#HNT is moving inside a falling wedge pattern on the 2-day timeframe. Consider buying a small bag here and on the support zone between $1.892 ~ $1.754. If price breaks above the wedge resistance and the 2-day SMA50, the potential targets are:
🎯 $2.401
🎯 $2.741
🎯 $3.046
🎯 $3.351
🎯 $3.785
🎯 $4.338
❌
See all ideas
Summarizing what the indicators are suggesting.
Oscillators
Neutral
Oscillators
Neutral
Summary
Neutral
Summary
Neutral
Summary
Neutral
Moving Averages
Neutral
Moving Averages
Neutral
Displays a symbol's price movements over previous years to identify recurring trends.