NAS100 trade ideas

NASDAQ BUY LEVEL @18734.4Another potential trade on NASDAQ. we looking to this trade only it brake level of 18734.4 than we will take our buy position.

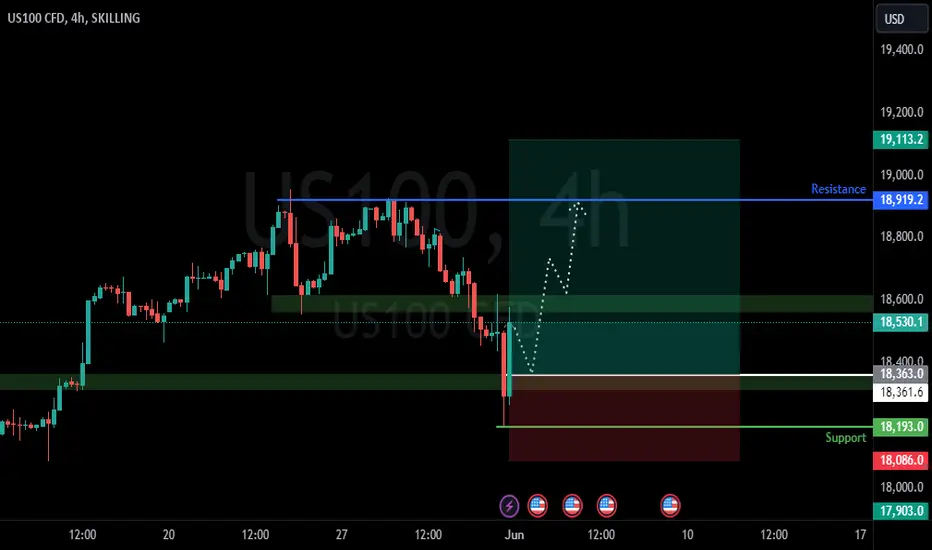
NASDAQNASDAQ: Sell
Open: 18660
SL: 19000
TP1 : 18000
TP2 : 17700
TP3 : 16700
================
Disclaimer: Any content in this text does not constitute investment advice. This text provides an objective description of the market situation and should not be considered an offer to sell or a solicitation to buy.
Any decisions made based on the information provided in this text are your personal responsibility. Any investments made or to be made should be analyzed based on your financial situation and personal goals.

US100 Is Very Bearish! Short!
Here is our detailed technical review for US100.
Time Frame: 8h
Current Trend: Bearish
Sentiment: Overbought (based on 7-period RSI)
Forecast: Bearish
The market is testing a major horizontal structure 19,056.1.
Taking into consideration the structure & trend analysis, I believe that the market will reach 18,811.5 level soon.
P.S
Please, note that an oversold/overbought condition can last for a long time, and therefore being oversold/overbought doesn't mean a price rally will come soon, or at all.
Like and subscribe and comment my ideas if you enjoy them!

Nasdaq 100 (CME) may fall to 18240.00 - 18430.00Pivot
18760.00
Our preference
Short positions below 18760.00 with targets at 18430.00 & 18240.00 in extension.
Alternative scenario
Above 18760.00 look for further upside with 18880.00 & 18980.00 as targets.
Comment
As long as 18760.00 is resistance, look for choppy price action with a bearish bias.
Supports and resistances
18980.00
18880.00
18760.00
18543.80 Last
18430.00
18240.00
18000.00
Number of asterisks represents the strength of support and resistance levels.

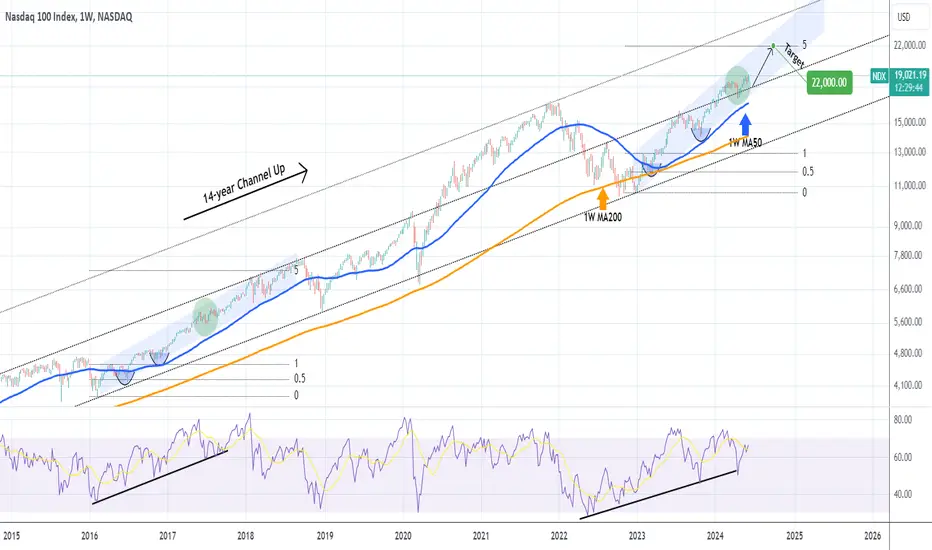
NASDAQ will continue to rise on this pattern repetition.Nasdaq (NDX) has been trading within a (blue) Channel Up since basically the market bottom of the inflation crisis in October 2022. On the bigger picture, this is the technical Bullish Leg of the 14-year Channel Up and is supported by the 1W MA50 (blue trend-line) since March 13 2023.
Based on the 1W RSI pattern, we have previously seen such Bullish Leg within the long-term Channel Up supported by the 1W MA50, back on the February 08 2016 bottom. As you can see on this 1W chart, both Bullish Legs (Channel Up patterns) made their first pull-back on the 0.5 Fibonacci retracement level. In June 2018, the previous fractal reached the 5.0 Fibonacci extension and shortly after, the index corrected aggressively back at the bottom of the 14-year Channel Up.
We expect Nasdaq to hit again the 5.0 Fib ext sooner or later but most likely before the year is over. This gives us a medium-term Target of 22000.
-------------------------------------------------------------------------------
** Please LIKE 👍, FOLLOW ✅, SHARE 🙌 and COMMENT ✍ if you enjoy this idea! Also share your ideas and charts in the comments section below! This is best way to keep it relevant, support us, keep the content here free and allow the idea to reach as many people as possible. **
-------------------------------------------------------------------------------
💸💸💸💸💸💸
👇 👇 👇 👇 👇 👇
NAS100: First green day, three days cycleHi everyone and welcome to my channel, please don’t forget to support all my work subscribing and liking my post, and for any question leave me a comment, I will be more than happy to help you!
“Trade setups, not movements”
1. DAY OF THE WEEK (Failed Breakout, False Break, Range Expansion)
Monday DAY 1 Opening Range
Tuesday DAY 2 Initial Balance ✅ day 3 cycle
Wednesday DAY 3 (reset DAY 1) Mid Point Week
Thursday DAY 2
Friday DAY 3 Closing Range
2. SIGNAL DAY
First Red Day
First Green Day ✅
3 Days Long Breakout
3 Days Short Breakout
Inside Day
3. WEEKLY TEMPLATE
Pump&Dump
Dump&Pump ✅
Frontside
Backside ✅
4. THESIS:
Long: primary, market potentially coiling for an explosive move back to the HOD or HOW, I will take this trade in consideration if buy 10am NYT the price action will be auctioning down low into the current LOD.
Short: secondary, is not the trade I'm interested today, but I can see a potential pump and dump starting from Friday LOW. If the market will keep breaking down for a pump and dump into the Friday CP, or market pumping back up into yesterday CP/HOD, then a sell high could also be an interesting alternative.
Please note that the purpose of my analysis is to help me and you hunting the best trade setup for the day, none of my technical aspects are a way to forecast any directional market movement.
Gianni

Free fall soon?Nasdaq broke the multi month ascending channel, and now seem to retest the zone where the channel broke in the first place, which is a good area for bears to enter the market with a good RR.


Good analysis, hope to help you!Hello, friends
Advance Stage support is not yet confirmed until we get 1 further support and 2 Retest.
Next retest must hold within the key level of $18,960.8
Then next ext prices:
The $19120 activity
The $19449.7
Us $19669
The $19797 activity
The $20063 activity
The $20289.9

NAS100: Inside dayHi everyone and welcome to my channel, please don’t forget to support all my work subscribing and liking my post, and for any question leave me a comment, I will be more than happy to help you!
“Trade setups, not movements”
1. DAY OF THE WEEK (Failed Breakout, False Break, Range Expansion)
Monday DAY 1 Opening Range
Tuesday DAY 2 Initial Balance
Wednesday DAY 3 (reset DAY 1) Mid Point Week ✅ potentially still day 3 cycle
Thursday DAY 2
Friday DAY 3 Closing Range
2. SIGNAL DAY
First Red Day
First Green Day
3 Days Long Breakout
3 Days Short Breakout
Inside Day ✅
3. WEEKLY TEMPLATE
Pump&Dump
Dump&Pump ✅
Frontside ✅
Backside
4. THESIS:
Long : primary, a buy low setup, back to the previous HOW, would be a really interesting opportunity to complete a two week dump and pump template. However, news till 10:30am, everything will be taken after all the MRN
Short: secondary: the inside day signal, is typically either a trend continuation or reversal, depending on how the 3 session Asia, London and NY setup. I do not exclude a reversal after major red news. Price currently on the HOW
Please note that the purpose of my analysis is to help me and you hunting the best trade setup for the day, none of my technical aspects are a way to forecast any directional market movement.
Gianni

price could go up higher anthor 500 points based on the fibonacci retracement tool i use price hit all the way down to 50% off and i bought at 37% of

NAS100 H4 | Bullish momentum to extend further?NAS100 could fall towards a pullback support and potentially bounce off this level to climb higher.
Buy entry is at 18,955.13 which is a pullback support.
Stop loss is at 18,670.00 which is a level that lies underneath an overlap support and the 38.2% Fibonacci retracement level.
Take profit is between 19,125.04 and 19,228.63 which is a zone that is identified by the 61.8% Fibonacci projection and the 127.2% Fibonacci extension levels.
High Risk Investment Warning
Trading Forex/CFDs on margin carries a high level of risk and may not be suitable for all investors. Leverage can work against you.
Stratos Markets Limited (www.fxcm.com):
CFDs are complex instruments and come with a high risk of losing money rapidly due to leverage. 68% of retail investor accounts lose money when trading CFDs with this provider. You should consider whether you understand how CFDs work and whether you can afford to take the high risk of losing your money.
Stratos Europe Ltd, previously FXCM EU Ltd (www.fxcm.com):
CFDs are complex instruments and come with a high risk of losing money rapidly due to leverage. 70% of retail investor accounts lose money when trading CFDs with this provider. You should consider whether you understand how CFDs work and whether you can afford to take the high risk of losing your money.
Stratos Trading Pty. Limited (www.fxcm.com):
Trading FX/CFDs carries significant risks. FXCM AU (AFSL 309763), please read the Financial Services Guide, Product Disclosure Statement, Target Market Determination and Terms of Business at www.fxcm.com
Stratos Global LLC (www.fxcm.com):
Losses can exceed deposits.
Please be advised that the information presented on TradingView is provided to FXCM (‘Company’, ‘we’) by a third-party provider (‘TFA Global Pte Ltd’). Please be reminded that you are solely responsible for the trading decisions on your account. There is a very high degree of risk involved in trading. Any information and/or content is intended entirely for research, educational and informational purposes only and does not constitute investment or consultation advice or investment strategy. The information is not tailored to the investment needs of any specific person and therefore does not involve a consideration of any of the investment objectives, financial situation or needs of any viewer that may receive it. Kindly also note that past performance is not a reliable indicator of future results. Actual results may differ materially from those anticipated in forward-looking or past performance statements. We assume no liability as to the accuracy or completeness of any of the information and/or content provided herein and the Company cannot be held responsible for any omission, mistake nor for any loss or damage including without limitation to any loss of profit which may arise from reliance on any information supplied by TFA Global Pte Ltd.
The speaker(s) is neither an employee, agent nor representative of FXCM and is therefore acting independently. The opinions given are their own, constitute general market commentary, and do not constitute the opinion or advice of FXCM or any form of personal or investment advice. FXCM neither endorses nor guarantees offerings of third-party speakers, nor is FXCM responsible for the content, veracity or opinions of third-party speakers, presenters or participants.

Competitive Markets are CompetitiveNice surprise today! I shorted at bell ring but not holding it. Closed after hours.
For the swingers, you're dead already.
For the noobs, you're wrong.
For the intraday warriors, it doesn't matter, you'll make money no matter what.
Competitive markets (BIG MARKETS) hunt liquidity.
Breakouts from ascending channels retest.
That means your ludicrous stop loss and "I know what the market should do" mentality will get you raked over the coals. Only the fittest survive.
The market is full of pavlovian dogs. "They" ring the bell, you come running in, salivating.
You say "the market only goes up!" because you got a cookie every time you said it.
And to all the confident shorts on the breakdown, you think you know what the market should do. It should go down. Respect the market. It will go and hunt your stop and humble you first.
I expect absolutely MINT trading conditions. Market will likely drop, build liquidity higher on the short interest, and go jab it out for a final hurrah and H+S setup. Maybe even higher again? There is always that last rip up where you think "oh yeah it just goes up forever" because you're the last, most basic schtick, you hold the very top of the the market when every fund has sold every position to ever simp on earth hoping to get rich.
But M2 is expanding, so maybe just so much money will be printed and spent by the US gov't that it looks like you are winning as inflation lifts all markets all the more, without any real gains.
Because there are so many chartists utterly detached from reality, I do expect some nice rallies in the downtrend. I'll keep selling into you on the rips. I'm sorry if that's you, but I appreciate the liquidity in those moments.
Expect the unexpected. Greed is in the market but the smart money is spending to get the market up only so they can sell it back after the lift.
"We'll just sell to those breakout idiots." - Quote from an actual fund manager.

NAS100 trade review / how I made 5000+ this morning !boost and follow if this helps and if you want more trade reviews ❤️🔥
charted out NAS this morning, saw the trend support that has held for a whole month, the short trap followed by trend resistance breakout.
and if that wasn't good enough, we had the resistance = support followed by a higher low. this pattern is a longs dream, so of course this gave me some confidence to long the market until my 18,900-19,000 targets hit.🎯
hope this helped break down my though process on some trades I take! last idea from me today see y'all soon hopefully.🙏

NAS100USD: Potential Buy Opportunity for NY SessionGreetings, Traders!
Brief Description🖊️:
Currently, institutional order flow on US100 is bullish, therefore we are looking for price to take sell stops in order for a turtle soup trade condition (false break).
Things I Have Seen👀:
Bullish Institutional Order Flow📈: Anticipating price to continue to the upside after sell stops have been taken. Smart money will look to order pair (buy against the sell-side liquidity).
Potential Sell Stops🔄: Price may take sell stops before buying, presenting a turtle soup condition (false break of structure). After sell stops have been taken, I will look to take a confirmation entry.
Bullish Targets📉:
Daily FVG: The primary target.
M15 Bearish Order Block: The secondary objective, with an expectation to fill the liquidity void there.
What's Important Now❗
Stay observant for price action around these key levels to confirm bullish continuation.
Best Regards,
The_Architect

bearish pressureUSNAS100
- Tendency :
the price is under bearish pressure 18,675
- Turning level :
The turning level is at 18,675 where price has now stabilized at the bottom
- resistance level :
Breaking the turning level 18,675 , the price will up to 18,795 and 18,885
- support level :
The trading stabilizing below 18,675 the price will reach the support level of 18,490 and 18,325
- corrective level :
price will attempt in 18,675 correct itself before falling

USNAS100 (More Bullish or Yet...)Technical Analysis
The price is expected to continue its bullish trend toward 18,735, having already stabilized in the bullish zone. The movement range will likely be between 18,550 and 18,820 until a breakout occurs.
Bullish Scenario: As long as the price remains above 18,600, it is likely to reach 18,735 and potentially 18,820.
Bearish Scenario: A stabilization below 18,550 would suggest a bearish trend, targeting 18,435 and 18,240.
Pivot Line: 18600
Resistance Levels: 18735, 18820, 18940
Support Levels: 18550, 18435, 18250
Today's range is expected to be between the support at 18230 and the resistance at 18820.

USNAS100 (HISTORICAL PEAK)USNAS100
Tendency the price is a long in 18,895
Turning level : The turning 18,895,so as long as the price trending above this level, there will be a bullish trend
resistance level : trade above 18,895, the price will rise to 19,050 , then trending in this level make a new peak
support level : braking a turning level 18,895 ,the price will reach the support level of
18,615 and 18,400
corrective level : price will attempt 18,895 , correct itself before long
* yesterday, price broke the turning level and broke the resistance zone create a historical
peak price

NASDAQ BUY TP HITHi traders our NASDAQ Trade went into our direction as analyzed lets close our trades and enjoy our profits.
Certified Price action king


US100 downside today? Given the large volume of liquidity around the 18,700 - 18,800 price range, we might expect some downside manipulation today. Considering the recent break to all-time highs, looking for LONG positions at this point could be seen as somewhat premature. It may be more prudent to wait for the market to complete a downward retracement before considering LONG positions.
However bare in mind upside continuation could occur.
NB: Be on the look out for the PUMP and DUMP.
Disclaimer: This information is for educational and informational purposes only and should not be construed as financial advice. Trading involves significant risk and may not be suitable for all investors. Always consult with a financial professional before making any investment decisions.
Happy and safe trading people.