NAS100 trade ideas

Buy Low Sell High NAS100Hey Traders Let’s have a great week !
I am looking to see a short to the downside, I have my key levels of Daily High/Low and Weekly High/Low marked.
You can see that price is respecting the Daily levels 18,985-19,034. Last week heavy momentum was bullish and has formed inefficient order blocks.
I’m looking for price to retest high at 19,068 and take profits to 18,587 before buying again unless price says other wise
Stay Consistent , Stay True , Believe In You
Tell me what you guys think of my idea. Let’s be respectful or i will eat you alive in the comments

NAS Buy Idea 5/19/24Looking for NAS to pull back no farther than the somewhere around 18168.8 (Mid-Point of the weekly consolidation + monthly bullish channel mid-point) and then continue bullish to the top of the weekly bullish channel that price is currently in around 19044
**This is for educational purposes only and this is not financial advice because I am not a financial advisor.**

NASNAS100 is in strong bullish trend, most probably chance price will continue it's momentum as price respected the support.

US100 Is Very Bearish! Short!
Here is our detailed technical review for US100.
Time Frame: 8h
Current Trend: Bearish
Sentiment: Overbought (based on 7-period RSI)
Forecast: Bearish
The market is testing a major horizontal structure 19,056.1.
Taking into consideration the structure & trend analysis, I believe that the market will reach 18,811.5 level soon.
P.S
Please, note that an oversold/overbought condition can last for a long time, and therefore being oversold/overbought doesn't mean a price rally will come soon, or at all.
Like and subscribe and comment my ideas if you enjoy them!

NAS100Continuation as per previous post.history repeats ,more upside predicted for the nas100 over the upcoming weeks

A BUY ENTRY ON US100
The market is on an uptrend and we are seeing a short buy and long buy entry. But the market can still go down to retest our strong support zone were is highlighted that the market respected and will look for strong buy opportunities. and the market can still break down our strong support zone to make sell opportunities as indicated on the chats.

JUNE 6TH SELL IDEA 2.0Price is setting up again. As said before the 50% of the monthly candle is a very long term goal. I will look to take profit at the TP 1 line on my chart here. The 50% of the daily gap would be good as well. Free fall time?

BACK TESTING 23 BEARISHTHERE WAS GAPS IN THE MARKET THAT NEEDED TO BE filled and usually all gaps get filled. this video display a misread in the market because the liquidity was filled despite the gaps. so it came and retested previous low and bullish back to the previous high. wrong analysis

back testing 24 bullishthe market was on a bullish creating new highs, also leaving gaps within the market and as taught by my mentor all gaps must be filled. eventually i knew the market will bearish, but the current trend was upward establishing new highs in the market before it filled the liquidity.

NAS100 Retested from the important support zone1. NAS100 Retested exactly from the support and trendline Liquidity.
2. Now its almost reaching the resistance zone.
3. Once its reached from the resistance we have to wait for a break or retest.
Please follow and support for more updates.

USNAS100 (Breakout Line, NFP, Jobs data )Futures Trade Cautiously Ahead of Jobs Data
U.S. stock index futures showed minimal movement on Friday as investors awaited a crucial employment report. This report is expected to confirm increasing slack in the U.S. labor market, potentially providing the Federal Reserve with more flexibility to cut interest rates later this year.
Technical Analysis
the price will move between 19100 and 18940 till breaking, stability above 19100 means the NFP is good and will continue the bullish trend to get 19250 and 19450
otherwise, stability under 18940 means will drop to 18820
Bullish Scenario: For the bullish trend to continue, the price needs to break above 19,100, with potential targets of 19,250 and 19,450.
Bearish Scenario: Stabilization below 19,100 would indicate a move towards 18,940. A further break below 18,940, confirmed by closing at least a 1-hour candle, would signal a downtrend towards 18,800.
Pivot Line: 19100
Resistance Levels: 19200, 19300, 19450
Support Levels: 18940, 18820, 18710
Today's range is expected to be between the support at 18820 and the resistance at 19450.
previous idea:

idea to be long in us100 nasdaq 60 % probabilityWe have the original bullish trend and the price is giving us signs of going long in very important areas and today we also have important news

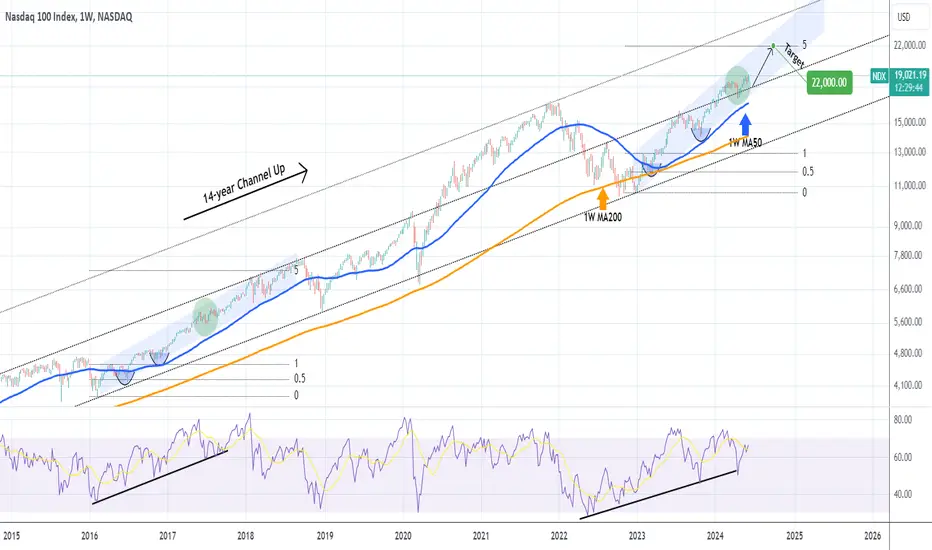
NASDAQ will continue to rise on this pattern repetition.Nasdaq (NDX) has been trading within a (blue) Channel Up since basically the market bottom of the inflation crisis in October 2022. On the bigger picture, this is the technical Bullish Leg of the 14-year Channel Up and is supported by the 1W MA50 (blue trend-line) since March 13 2023.
Based on the 1W RSI pattern, we have previously seen such Bullish Leg within the long-term Channel Up supported by the 1W MA50, back on the February 08 2016 bottom. As you can see on this 1W chart, both Bullish Legs (Channel Up patterns) made their first pull-back on the 0.5 Fibonacci retracement level. In June 2018, the previous fractal reached the 5.0 Fibonacci extension and shortly after, the index corrected aggressively back at the bottom of the 14-year Channel Up.
We expect Nasdaq to hit again the 5.0 Fib ext sooner or later but most likely before the year is over. This gives us a medium-term Target of 22000.
-------------------------------------------------------------------------------
** Please LIKE 👍, FOLLOW ✅, SHARE 🙌 and COMMENT ✍ if you enjoy this idea! Also share your ideas and charts in the comments section below! This is best way to keep it relevant, support us, keep the content here free and allow the idea to reach as many people as possible. **
-------------------------------------------------------------------------------
💸💸💸💸💸💸
👇 👇 👇 👇 👇 👇
USNAS100 ( UNDER NFP PRESSURE )USNAS100
Tendency the price is a long in 18,920
Turning level : The turning 18,920,so as long as the price trending above this level, there will be a bullish trend
resistance level : trade above 18,920, the price will rise to 19,050 , then trending in this level make a new peak
support level : braking a turning level 18,920 ,the price will reach the support level
of 18,615 and 18,400
corrective level : price will attempt 18,920 , correct itself before long
* today we have some news , I urge traders to trade cautiously

USNAS100 (HISTORICAL PEAK)USNAS100
Tendency the price is a long in 18,895
Turning level : The turning 18,895,so as long as the price trending above this level, there will be a bullish trend
resistance level : trade above 18,895, the price will rise to 19,050 , then trending in this level make a new peak
support level : braking a turning level 18,895 ,the price will reach the support level of
18,615 and 18,400
corrective level : price will attempt 18,895 , correct itself before long
* yesterday, price broke the turning level and broke the resistance zone create a historical
peak price


Us100_shI believe the price has reached an overbought stage, and we might see a strong decline towards the specified areas. Currently, the price is in a distribution zone. We could witness a rapid surge to break the selling positions, followed by a continuation of the decline. Therefore, my stop-loss is set to be triggered by the closure of a 15-minute candle above the specified area shown in the image to stop the loss.

NASDAQSo we hit ATH again! Good work to all those who bought all the way up.
Now, it's time us bears take over.
Price moved up very aggressively and is due for a correction or relief.
We formed a nice double top which is indicating that the bulls are done and ready to step down.
Selling at the current level is not a bad move. I have opened a short with a tight SL.
Let's see what impact the news and NFP will have moving towards the end of the week.
Good luck, have fun!

NAS100 H4 | Bullish momentum to extend further?NAS100 could fall towards a pullback support and potentially bounce off this level to climb higher.
Buy entry is at 18,955.13 which is a pullback support.
Stop loss is at 18,670.00 which is a level that lies underneath an overlap support and the 38.2% Fibonacci retracement level.
Take profit is between 19,125.04 and 19,228.63 which is a zone that is identified by the 61.8% Fibonacci projection and the 127.2% Fibonacci extension levels.
High Risk Investment Warning
Trading Forex/CFDs on margin carries a high level of risk and may not be suitable for all investors. Leverage can work against you.
Stratos Markets Limited (www.fxcm.com):
CFDs are complex instruments and come with a high risk of losing money rapidly due to leverage. 68% of retail investor accounts lose money when trading CFDs with this provider. You should consider whether you understand how CFDs work and whether you can afford to take the high risk of losing your money.
Stratos Europe Ltd, previously FXCM EU Ltd (www.fxcm.com):
CFDs are complex instruments and come with a high risk of losing money rapidly due to leverage. 70% of retail investor accounts lose money when trading CFDs with this provider. You should consider whether you understand how CFDs work and whether you can afford to take the high risk of losing your money.
Stratos Trading Pty. Limited (www.fxcm.com):
Trading FX/CFDs carries significant risks. FXCM AU (AFSL 309763), please read the Financial Services Guide, Product Disclosure Statement, Target Market Determination and Terms of Business at www.fxcm.com
Stratos Global LLC (www.fxcm.com):
Losses can exceed deposits.
Please be advised that the information presented on TradingView is provided to FXCM (‘Company’, ‘we’) by a third-party provider (‘TFA Global Pte Ltd’). Please be reminded that you are solely responsible for the trading decisions on your account. There is a very high degree of risk involved in trading. Any information and/or content is intended entirely for research, educational and informational purposes only and does not constitute investment or consultation advice or investment strategy. The information is not tailored to the investment needs of any specific person and therefore does not involve a consideration of any of the investment objectives, financial situation or needs of any viewer that may receive it. Kindly also note that past performance is not a reliable indicator of future results. Actual results may differ materially from those anticipated in forward-looking or past performance statements. We assume no liability as to the accuracy or completeness of any of the information and/or content provided herein and the Company cannot be held responsible for any omission, mistake nor for any loss or damage including without limitation to any loss of profit which may arise from reliance on any information supplied by TFA Global Pte Ltd.
The speaker(s) is neither an employee, agent nor representative of FXCM and is therefore acting independently. The opinions given are their own, constitute general market commentary, and do not constitute the opinion or advice of FXCM or any form of personal or investment advice. FXCM neither endorses nor guarantees offerings of third-party speakers, nor is FXCM responsible for the content, veracity or opinions of third-party speakers, presenters or participants.

NASDAQ100 INDEX - 4h Technical analysisThe current short-term bullish acceleration on NASDAQ100 INDEX should quickly allow the basic trend to return to bullish. To avoid contradicting the short term, traders may prefer long positions (at the time of purchase) as long as the price remains well above 18,433.66 USD. Short-term buyers will use the resistance located at 18,677.55 USD as an objective. A bullish break in this resistance would boost the bullish momentum. The next bullish objective would then be set at 18,818.44 USD. Crossing this resistance would then open the door for buyers to target 19,062.33 USD. Caution, if there is a return to under 18,433.66 USD, it should not be forgotten that the basic trend is not yet clearly defined. Beware of against the trend sellers, many of whom will certainly benefit from this movement.

Bullish Momentum Persists Despite NAS100 Selling PressureHello Everyone,
Once more, we've achieved our target for NAS100! Despite witnessing substantial selling pressure, the prevailing outlook remains bullish, indicating an enduring positive sentiment.
TradeWithTheTrend3344

Will Nasdaq repeat a measured moveFrom the look of things Nasdaq might just be heading to complete a second leg of a simple measured move.... which will plunge into the 20,000 levels
