ICXUSD.P trade ideas

ICX @2.75 could rise from now!KRAKEN:ICXUSD is going up - there is some resistance at 2.88, will see how it does there if it passes and tests it as a support level the target could be as high as 3.07.


Elliott Wave Analysis: ICXUSD Is Hunting New HighsHello Crypto traders!
Today we will talk about ICON (ICXUSD), its price action from technical point of view and wave structure from Elliott Wave perspective.
Well, ICX is in a clear impulsive uptrend within a five-wave cycle from March 2020 lows and seems like the final (5) can be now in play after we noticed nice a complex W-X-Y corrective movement in wave (4) with perfect support at the former wave 4 and 1.7 level.
Anyway, as you can see, ICX bounced sharply and impulsively with five waves on the intraday basis, which suggest more upside as part of a new five-wave cycle within wave (5) that can push the price even up to 4.0 area, especially if we see broken channel resistance line.
Be humble and trade smart!
If you like what we do, then please like and share our idea!
Disclosure: Please be informed that information we provide is NOT a trading recommendation or investment advice. All of our work is for educational purposes only.

I whip through #some #altcoins... #miota #cake #klay #icx #hot #luna
#avax
they all look good
all very #tradeable
Use margin & leverage judiciously !!!
It is an amplifier
don't blow your eardrums out!!!


ICX the break of down trend can move it more UPICX i dot advice for buy now because we can't find good SL but the break of down trend can move it more up


ICX preparing new breakout $ICX is trending sideways around $2.75 the next range breakout ($2.92) would activate a new price level at $3.85. For this however, more volume must come as in the previous jumps and the RSI must defend the 48.5.
#icon #ICXUSD #ICXUSDT #Cryptoart

Playing w icx.So i set this up few days ago. It remains on my channel trend and set a breakout. Feel this is the fake breakout though possibility of good rush w the reverse hns. but if this finishes its course theres a cup n handle forming so it will target 3.11 then maybe retrace to 2.80 area before a major decision to the next level
This is just an idea
take at your own risk
thanksguys


ICX about to explode?What do you think? For ICX, on the daily, this looks like a tightening wedge with declining volume to me. If so, the target seems to be around $4 IF it breaks up with significant volume (rather than down). Do you agree or not?

ICX what way will it go ???Which one will play out ??? 28% down to the curve or a 80% break out to 4.79$ resistance. Lets see :)

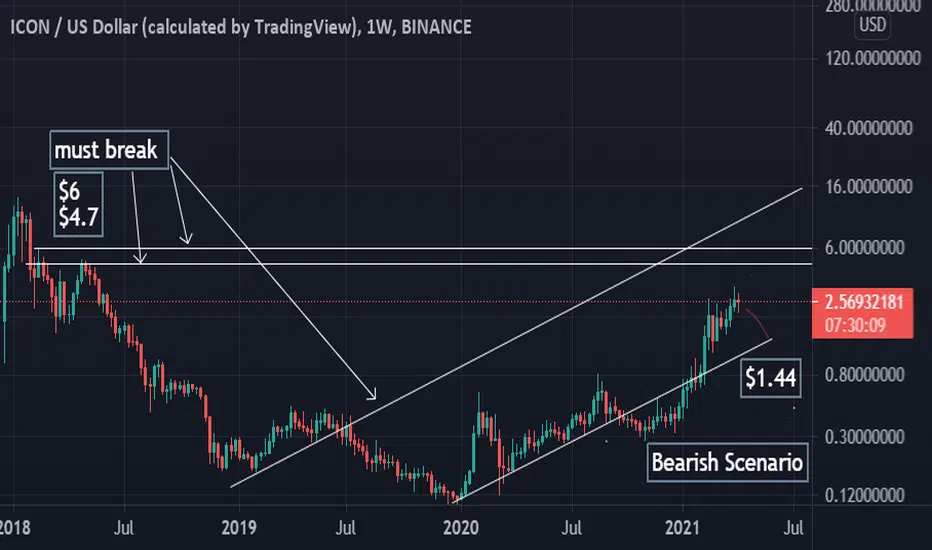

ICX will have an explosive move SOON! Do not miss it this trade!To predict the future, you need to look into the past. In the past, whenever we cross on the Stochastic RSI on the daily, we increase 84-300%. We are about to have a Bullish cross again. We also stayed strong above the 20EMA meaning bullish momentum!
I will not waste this trade coming up! It will be big!!
Check out the Altcoin season chart below (Crypto Total Market Cap Excluding BTC ). We are on the verge of another altcoin super cycle
Bitcoin dominance will die down and Altcoins will take over!! Whales/bots/institutions will be moving their Bitcoin ( BTC ) into the Altcoins, meaning Altcoin Season is just getting started.
Money flows like this:
FIAT > BITCOIN > LARGE MARKET CAP COINS > MIDDLE MARKET CAP COINS > SMALL MARKET CAP COINS > back to FIAT, and the cycle starts again.
I have moved majority of my BTC and diverse them into different altcoin positions. (ETH, HBAR, GRT , XLM , XRP, NEO, SNX , BNT, BCH, ADA, LTC, NU, LINK, and ALGO are the some of the altcoins I am moving BTC too).
Get ready to have an explosive Altcoin season just like what happen in the 2017 bull market. Once my sell indicators hit, I will be selling my positions to buy real estate, a lambo ;) , and moving the rest to Ethereum to Stake it!
Good Luck!
"Markets are a device for transferring money from the impatient to the patient. - Warren Buffet
"Be fearful when others are greedy and greedy when others are fearful." - Warren Buffet.
"Show me the charts, and I'll tell you the news." - Bernard Baruch

Icon (ICX) - April 11Hello?
Dear traders, nice to meet you.
By "following" you can always get new information quickly.
Please also ask for the "Like" clock.
Have a good day.
----------------------------------
It remains to be seen if it can rise above the previous high of 2.637545532.
If you decline at the point of 2.319756656, you need a short Stop Loss.
However, it may rise along the uptrend line, so careful trading is necessary.
In the CCI-RC indicator, it remains to be seen whether the CCI line can break above the EMA line and continue the uptrend.
If the CCI line falls below 100 points, volatility may occur, so careful trading is necessary.
The next volatility period is around April 16th.
----------------------------------
(ICXBTC 1D chart)
It remains to be seen if it is supported by the 4176 Satoshi-4517 Satoshi section and can climb along the uptrend line.
If you fall below the downtrend channel, you can touch the 2773 Satoshi spot, so you need to trade carefully.
-------------------------------------------------- -------------------------------------------
** All indicators are lagging indicators.
So, it's important to be aware that the indicator moves accordingly with the movement of price and volume.
Just for the sake of convenience, we are talking upside down for interpretation of the indicators.
** The wRSI_SR indicator is an indicator created by adding settings and options from the existing Stochastic RSI indicator.
Therefore, the interpretation is the same as the conventional stochastic RSI indicator. (K, D line -> R, S line)
** The OBV indicator was re-created by applying a formula to the DepthHouse Trading indicator, an indicator that oh92 disclosed. (Thank you for this.)
** Check support, resistance, and abbreviation points.
** Support or resistance is based on the closing price of the 1D chart.
** All explanations are for reference only and do not guarantee profit or loss on investment.
Explanation of abbreviations displayed on the chart
R: A point or section of resistance that requires a response to preserve profits
S-L: Stop Loss point or section
S: A point or segment that can be bought for profit generation as a support point or segment
(Short-term Stop Loss can be said to be a point where profits and losses can be preserved or additionally entered through installment transactions. It is a short-term investment perspective.
GAP refers to the difference in prices that occurred when the stock market, CME, and BAKKT exchanges were closed because they do not trade 24 hours a day.
G1: Closing price when closed
G2: Cigar at the time of opening
(Example) Gap (G1-G2)


ICX EXTREMELY BULLISH All time low volume
Stagnant and consolidating accumulation.
Proves a new support at 2.3 area.
Prepare for this coin to skyrocket. The next bursts of buying will send this to the moon
